Cities with the Highest Percentage of Mexican Population in Massachusetts
RELATED REPORTS & OPTIONS
Mexican
Massachusetts
Compare Cities
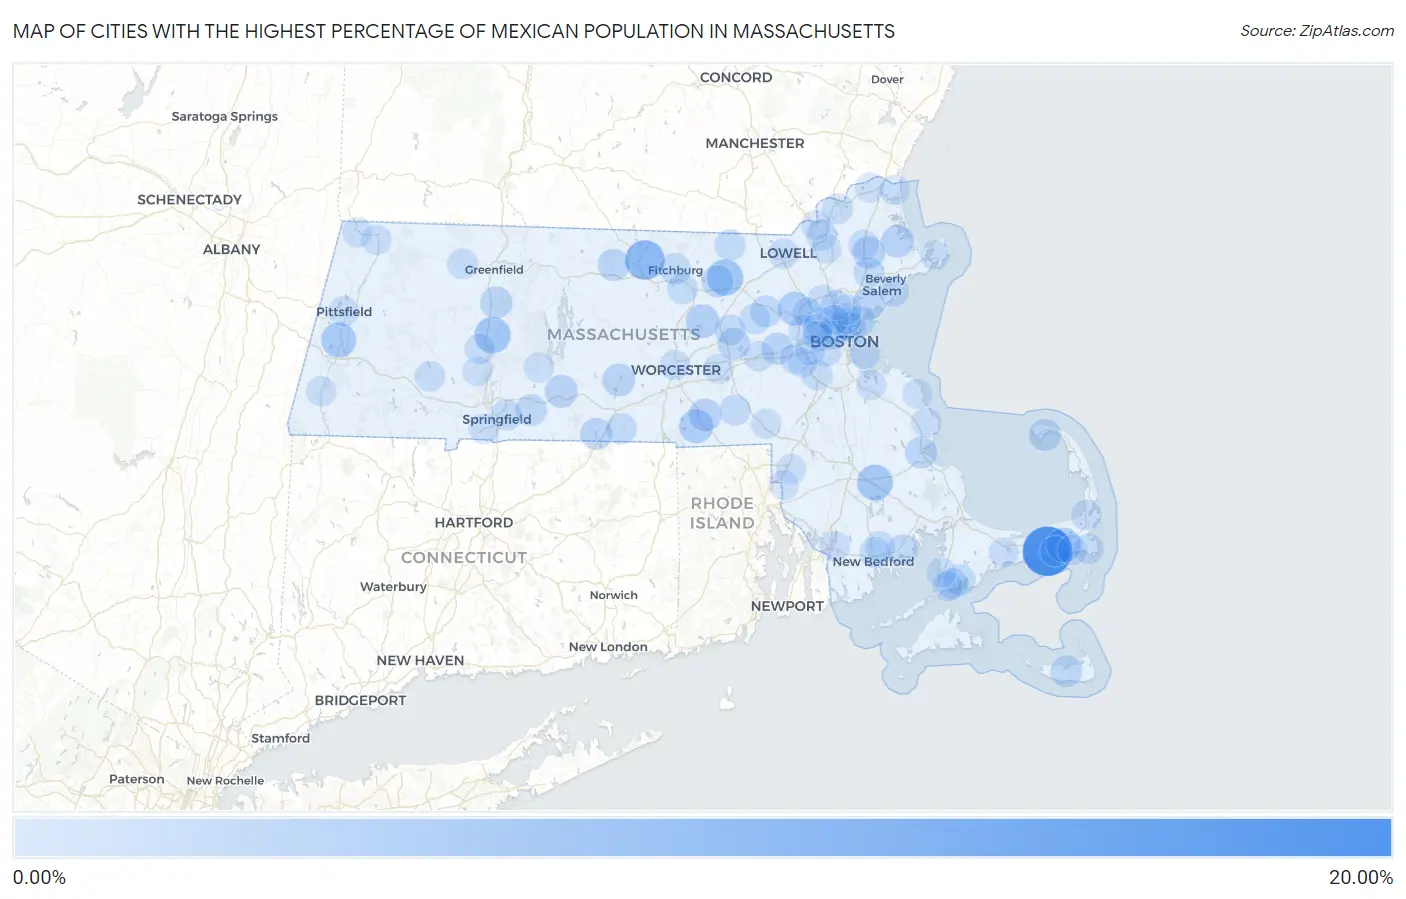
Map of Cities with the Highest Percentage of Mexican Population in Massachusetts
0.00%
20.00%
Cities with the Highest Percentage of Mexican Population in Massachusetts
| City | Mexican | vs State | vs National | |
| 1. | West Dennis | 18.37% | 0.74%(+17.6)#1 | 11.22%(+7.16)#3,293 |
| 2. | South Ashburnham | 8.96% | 0.74%(+8.22)#2 | 11.22%(-2.26)#5,680 |
| 3. | Ayer | 6.00% | 0.74%(+5.25)#3 | 11.22%(-5.22)#7,441 |
| 4. | Hatfield | 5.94% | 0.74%(+5.19)#4 | 11.22%(-5.28)#7,496 |
| 5. | Middleborough Center | 5.44% | 0.74%(+4.70)#5 | 11.22%(-5.78)#7,911 |
| 6. | Lenox | 4.85% | 0.74%(+4.11)#6 | 11.22%(-6.37)#8,490 |
| 7. | Northwest Harwich | 4.42% | 0.74%(+3.67)#7 | 11.22%(-6.80)#8,988 |
| 8. | East Douglas | 4.02% | 0.74%(+3.28)#8 | 11.22%(-7.20)#9,434 |
| 9. | Hanscom Afb | 3.92% | 0.74%(+3.18)#9 | 11.22%(-7.30)#9,534 |
| 10. | Clinton | 3.55% | 0.74%(+2.80)#10 | 11.22%(-7.67)#10,053 |
| 11. | Whitinsville | 2.98% | 0.74%(+2.24)#11 | 11.22%(-8.24)#10,940 |
| 12. | Palmer Town | 2.89% | 0.74%(+2.15)#12 | 11.22%(-8.33)#11,121 |
| 13. | Ipswich | 2.85% | 0.74%(+2.11)#13 | 11.22%(-8.37)#11,188 |
| 14. | East Brookfield | 2.75% | 0.74%(+2.01)#14 | 11.22%(-8.47)#11,362 |
| 15. | Topsfield | 2.72% | 0.74%(+1.97)#15 | 11.22%(-8.50)#11,427 |
| 16. | Cochituate | 2.42% | 0.74%(+1.68)#16 | 11.22%(-8.80)#12,052 |
| 17. | Kingston | 2.33% | 0.74%(+1.59)#17 | 11.22%(-8.89)#12,254 |
| 18. | Baldwinville | 2.27% | 0.74%(+1.53)#18 | 11.22%(-8.94)#12,379 |
| 19. | Devens | 2.27% | 0.74%(+1.53)#19 | 11.22%(-8.95)#12,396 |
| 20. | South Deerfield | 2.25% | 0.74%(+1.51)#20 | 11.22%(-8.97)#12,433 |
| 21. | Provincetown | 2.24% | 0.74%(+1.50)#21 | 11.22%(-8.98)#12,453 |
| 22. | Lynn | 2.20% | 0.74%(+1.46)#22 | 11.22%(-9.02)#12,544 |
| 23. | Marlborough | 2.17% | 0.74%(+1.43)#23 | 11.22%(-9.05)#12,637 |
| 24. | Holland | 2.13% | 0.74%(+1.39)#24 | 11.22%(-9.08)#12,719 |
| 25. | Nantucket | 2.06% | 0.74%(+1.32)#25 | 11.22%(-9.16)#12,900 |
| 26. | West Concord | 1.84% | 0.74%(+1.10)#26 | 11.22%(-9.37)#13,467 |
| 27. | Wilbraham | 1.82% | 0.74%(+1.08)#27 | 11.22%(-9.40)#13,521 |
| 28. | Fitchburg | 1.76% | 0.74%(+1.02)#28 | 11.22%(-9.46)#13,664 |
| 29. | East Falmouth | 1.69% | 0.74%(+0.951)#29 | 11.22%(-9.53)#13,859 |
| 30. | Mattapoisett Center | 1.47% | 0.74%(+0.733)#30 | 11.22%(-9.74)#14,452 |
| 31. | Maynard | 1.45% | 0.74%(+0.711)#31 | 11.22%(-9.77)#14,514 |
| 32. | Somerville | 1.41% | 0.74%(+0.664)#32 | 11.22%(-9.81)#14,643 |
| 33. | Hopedale | 1.40% | 0.74%(+0.661)#33 | 11.22%(-9.82)#14,661 |
| 34. | Southbridge Town | 1.40% | 0.74%(+0.657)#34 | 11.22%(-9.82)#14,674 |
| 35. | Everett | 1.31% | 0.74%(+0.567)#35 | 11.22%(-9.91)#14,971 |
| 36. | East Pepperell | 1.30% | 0.74%(+0.559)#36 | 11.22%(-9.92)#14,998 |
| 37. | Springfield | 1.29% | 0.74%(+0.546)#37 | 11.22%(-9.93)#15,037 |
| 38. | Teaticket | 1.28% | 0.74%(+0.540)#38 | 11.22%(-9.94)#15,058 |
| 39. | Revere | 1.26% | 0.74%(+0.520)#39 | 11.22%(-9.96)#15,110 |
| 40. | Hudson | 1.25% | 0.74%(+0.511)#40 | 11.22%(-9.97)#15,143 |
| 41. | Arlington | 1.25% | 0.74%(+0.509)#41 | 11.22%(-9.97)#15,148 |
| 42. | New Bedford | 1.21% | 0.74%(+0.469)#42 | 11.22%(-10.0)#15,286 |
| 43. | Lawrence | 1.21% | 0.74%(+0.468)#43 | 11.22%(-10.0)#15,291 |
| 44. | Leominster | 1.21% | 0.74%(+0.464)#44 | 11.22%(-10.0)#15,303 |
| 45. | Danvers | 1.19% | 0.74%(+0.452)#45 | 11.22%(-10.0)#15,349 |
| 46. | Cambridge | 1.18% | 0.74%(+0.438)#46 | 11.22%(-10.0)#15,393 |
| 47. | Salem | 1.17% | 0.74%(+0.426)#47 | 11.22%(-10.1)#15,430 |
| 48. | Shelburne Falls | 1.12% | 0.74%(+0.377)#48 | 11.22%(-10.1)#15,596 |
| 49. | Waltham | 1.12% | 0.74%(+0.376)#49 | 11.22%(-10.1)#15,599 |
| 50. | Boston | 1.11% | 0.74%(+0.370)#50 | 11.22%(-10.1)#15,618 |
| 51. | Haverhill | 1.07% | 0.74%(+0.330)#51 | 11.22%(-10.1)#15,758 |
| 52. | Chelsea | 0.99% | 0.74%(+0.251)#52 | 11.22%(-10.2)#16,075 |
| 53. | Brookline | 0.93% | 0.74%(+0.187)#53 | 11.22%(-10.3)#16,306 |
| 54. | Dedham | 0.93% | 0.74%(+0.185)#54 | 11.22%(-10.3)#16,311 |
| 55. | Huntington | 0.92% | 0.74%(+0.183)#55 | 11.22%(-10.3)#16,319 |
| 56. | Orleans | 0.90% | 0.74%(+0.159)#56 | 11.22%(-10.3)#16,410 |
| 57. | Amherst | 0.88% | 0.74%(+0.142)#57 | 11.22%(-10.3)#16,480 |
| 58. | Worcester | 0.85% | 0.74%(+0.113)#58 | 11.22%(-10.4)#16,594 |
| 59. | Agawam Town | 0.82% | 0.74%(+0.080)#59 | 11.22%(-10.4)#16,727 |
| 60. | Wellesley | 0.80% | 0.74%(+0.059)#60 | 11.22%(-10.4)#16,806 |
| 61. | West Chatham | 0.80% | 0.74%(+0.055)#61 | 11.22%(-10.4)#16,826 |
| 62. | Pittsfield | 0.79% | 0.74%(+0.050)#62 | 11.22%(-10.4)#16,844 |
| 63. | Boxford | 0.77% | 0.74%(+0.032)#63 | 11.22%(-10.4)#16,931 |
| 64. | Framingham | 0.77% | 0.74%(+0.025)#64 | 11.22%(-10.5)#16,962 |
| 65. | Lowell | 0.76% | 0.74%(+0.020)#65 | 11.22%(-10.5)#16,981 |
| 66. | Malden | 0.76% | 0.74%(+0.019)#66 | 11.22%(-10.5)#16,986 |
| 67. | Falmouth | 0.75% | 0.74%(+0.005)#67 | 11.22%(-10.5)#17,042 |
| 68. | Newton | 0.74% | 0.74%(-0.004)#68 | 11.22%(-10.5)#17,081 |
| 69. | Northampton | 0.73% | 0.74%(-0.016)#69 | 11.22%(-10.5)#17,132 |
| 70. | Marshfield | 0.72% | 0.74%(-0.022)#70 | 11.22%(-10.5)#17,153 |
| 71. | Woburn | 0.71% | 0.74%(-0.029)#71 | 11.22%(-10.5)#17,184 |
| 72. | Melrose | 0.71% | 0.74%(-0.032)#72 | 11.22%(-10.5)#17,197 |
| 73. | Stoneham | 0.71% | 0.74%(-0.032)#73 | 11.22%(-10.5)#17,198 |
| 74. | Acushnet Center | 0.70% | 0.74%(-0.046)#74 | 11.22%(-10.5)#17,239 |
| 75. | Medford | 0.68% | 0.74%(-0.066)#75 | 11.22%(-10.5)#17,318 |
| 76. | Dennis Port | 0.67% | 0.74%(-0.075)#76 | 11.22%(-10.6)#17,350 |
| 77. | Weymouth Town | 0.64% | 0.74%(-0.101)#77 | 11.22%(-10.6)#17,448 |
| 78. | Westborough | 0.64% | 0.74%(-0.102)#78 | 11.22%(-10.6)#17,453 |
| 79. | Great Barrington | 0.63% | 0.74%(-0.106)#79 | 11.22%(-10.6)#17,478 |
| 80. | Lexington | 0.63% | 0.74%(-0.113)#80 | 11.22%(-10.6)#17,507 |
| 81. | Franklin Town | 0.62% | 0.74%(-0.122)#81 | 11.22%(-10.6)#17,546 |
| 82. | Andover | 0.62% | 0.74%(-0.126)#82 | 11.22%(-10.6)#17,568 |
| 83. | Belmont | 0.61% | 0.74%(-0.127)#83 | 11.22%(-10.6)#17,574 |
| 84. | Belchertown | 0.60% | 0.74%(-0.137)#84 | 11.22%(-10.6)#17,622 |
| 85. | Barnstable Town | 0.60% | 0.74%(-0.138)#85 | 11.22%(-10.6)#17,630 |
| 86. | North Adams | 0.60% | 0.74%(-0.138)#86 | 11.22%(-10.6)#17,631 |
| 87. | Fall River | 0.60% | 0.74%(-0.140)#87 | 11.22%(-10.6)#17,640 |
| 88. | Watertown Town | 0.60% | 0.74%(-0.142)#88 | 11.22%(-10.6)#17,649 |
| 89. | Needham | 0.56% | 0.74%(-0.178)#89 | 11.22%(-10.7)#17,797 |
| 90. | Salisbury | 0.51% | 0.74%(-0.229)#90 | 11.22%(-10.7)#17,996 |
| 91. | Gloucester | 0.51% | 0.74%(-0.232)#91 | 11.22%(-10.7)#18,011 |
| 92. | Attleboro | 0.50% | 0.74%(-0.239)#92 | 11.22%(-10.7)#18,043 |
| 93. | Williamstown | 0.49% | 0.74%(-0.252)#93 | 11.22%(-10.7)#18,095 |
| 94. | North Seekonk | 0.48% | 0.74%(-0.265)#94 | 11.22%(-10.7)#18,155 |
| 95. | Methuen Town | 0.48% | 0.74%(-0.266)#95 | 11.22%(-10.7)#18,157 |
| 96. | Easthampton Town | 0.46% | 0.74%(-0.277)#96 | 11.22%(-10.8)#18,209 |
| 97. | Scituate | 0.46% | 0.74%(-0.282)#97 | 11.22%(-10.8)#18,238 |
| 98. | West Falmouth | 0.45% | 0.74%(-0.295)#98 | 11.22%(-10.8)#18,314 |
| 99. | Amesbury Town | 0.45% | 0.74%(-0.296)#99 | 11.22%(-10.8)#18,317 |
| 100. | Harwich Port | 0.44% | 0.74%(-0.297)#100 | 11.22%(-10.8)#18,327 |
Common Questions
What are the Top 10 Cities with the Highest Percentage of Mexican Population in Massachusetts?
Top 10 Cities with the Highest Percentage of Mexican Population in Massachusetts are:
#1
18.37%
#2
8.96%
#3
6.00%
#4
5.94%
#5
5.44%
#6
4.85%
#7
4.42%
#8
4.02%
#9
3.92%
#10
3.55%
What city has the Highest Percentage of Mexican Population in Massachusetts?
West Dennis has the Highest Percentage of Mexican Population in Massachusetts with 18.37%.
What is the Percentage of Mexican Population in the State of Massachusetts?
Percentage of Mexican Population in Massachusetts is 0.74%.
What is the Percentage of Mexican Population in the United States?
Percentage of Mexican Population in the United States is 11.22%.