Cities with the Highest Percentage of Mexican Population in Ohio
RELATED REPORTS & OPTIONS
Mexican
Ohio
Compare Cities
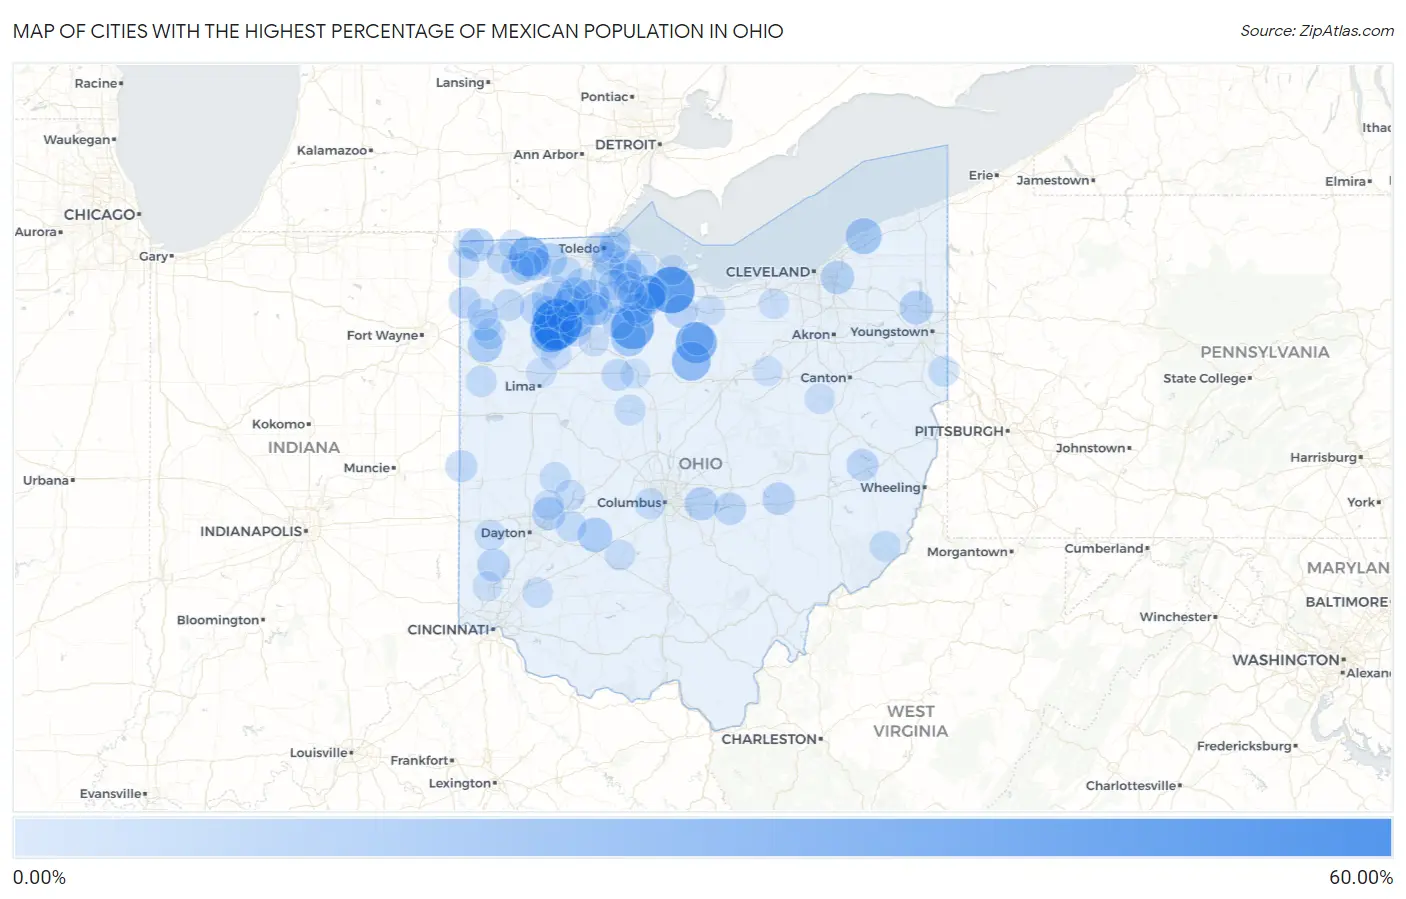
Map of Cities with the Highest Percentage of Mexican Population in Ohio
0.00%
60.00%
Cities with the Highest Percentage of Mexican Population in Ohio
| City | Mexican | vs State | vs National | |
| 1. | Belmore | 54.26% | 1.83%(+52.4)#1 | 11.22%(+43.0)#1,027 |
| 2. | Vickery | 46.64% | 1.83%(+44.8)#2 | 11.22%(+35.4)#1,265 |
| 3. | Bascom | 37.98% | 1.83%(+36.2)#3 | 11.22%(+26.8)#1,616 |
| 4. | West Leipsic | 35.63% | 1.83%(+33.8)#4 | 11.22%(+24.4)#1,734 |
| 5. | Leipsic | 34.00% | 1.83%(+32.2)#5 | 11.22%(+22.8)#1,854 |
| 6. | Celeryville | 33.02% | 1.83%(+31.2)#6 | 11.22%(+21.8)#1,922 |
| 7. | Tedrow | 28.80% | 1.83%(+27.0)#7 | 11.22%(+17.6)#2,205 |
| 8. | Tiro | 27.27% | 1.83%(+25.4)#8 | 11.22%(+16.1)#2,345 |
| 9. | New Haven Cdp Huron County | 24.81% | 1.83%(+23.0)#9 | 11.22%(+13.6)#2,570 |
| 10. | Stony Prairie | 23.07% | 1.83%(+21.2)#10 | 11.22%(+11.9)#2,727 |
| 11. | Hoytville | 22.55% | 1.83%(+20.7)#11 | 11.22%(+11.3)#2,771 |
| 12. | Portage | 20.67% | 1.83%(+18.8)#12 | 11.22%(+9.46)#2,978 |
| 13. | Ai | 20.41% | 1.83%(+18.6)#13 | 11.22%(+9.19)#3,015 |
| 14. | Painesville | 20.03% | 1.83%(+18.2)#14 | 11.22%(+8.81)#3,078 |
| 15. | New Riegel | 18.29% | 1.83%(+16.5)#15 | 11.22%(+7.07)#3,309 |
| 16. | Haviland | 17.13% | 1.83%(+15.3)#16 | 11.22%(+5.91)#3,498 |
| 17. | South Solon | 16.88% | 1.83%(+15.1)#17 | 11.22%(+5.66)#3,543 |
| 18. | Weston | 16.77% | 1.83%(+14.9)#18 | 11.22%(+5.55)#3,567 |
| 19. | Burgoon | 16.00% | 1.83%(+14.2)#19 | 11.22%(+4.78)#3,697 |
| 20. | Delta | 14.82% | 1.83%(+13.0)#20 | 11.22%(+3.60)#3,916 |
| 21. | Jerry City | 14.77% | 1.83%(+12.9)#21 | 11.22%(+3.55)#3,935 |
| 22. | Morgandale | 14.47% | 1.83%(+12.6)#22 | 11.22%(+3.26)#4,010 |
| 23. | Milton Center | 14.36% | 1.83%(+12.5)#23 | 11.22%(+3.14)#4,033 |
| 24. | Woodmere | 14.20% | 1.83%(+12.4)#24 | 11.22%(+2.98)#4,069 |
| 25. | Bettsville | 14.00% | 1.83%(+12.2)#25 | 11.22%(+2.78)#4,121 |
| 26. | Etna | 13.99% | 1.83%(+12.2)#26 | 11.22%(+2.77)#4,124 |
| 27. | Lake Seneca | 13.90% | 1.83%(+12.1)#27 | 11.22%(+2.68)#4,141 |
| 28. | Crystal Lakes | 13.77% | 1.83%(+11.9)#28 | 11.22%(+2.55)#4,164 |
| 29. | Willard | 13.67% | 1.83%(+11.8)#29 | 11.22%(+2.45)#4,190 |
| 30. | Walbridge | 13.56% | 1.83%(+11.7)#30 | 11.22%(+2.34)#4,212 |
| 31. | Wauseon | 13.03% | 1.83%(+11.2)#31 | 11.22%(+1.81)#4,334 |
| 32. | Elmore | 12.99% | 1.83%(+11.2)#32 | 11.22%(+1.77)#4,341 |
| 33. | Fremont | 12.96% | 1.83%(+11.1)#33 | 11.22%(+1.74)#4,346 |
| 34. | Jacksonburg | 12.82% | 1.83%(+11.0)#34 | 11.22%(+1.60)#4,390 |
| 35. | Genoa | 12.65% | 1.83%(+10.8)#35 | 11.22%(+1.43)#4,432 |
| 36. | Fostoria | 12.44% | 1.83%(+10.6)#36 | 11.22%(+1.22)#4,481 |
| 37. | North Zanesville | 12.38% | 1.83%(+10.6)#37 | 11.22%(+1.16)#4,492 |
| 38. | Bradner | 12.34% | 1.83%(+10.5)#38 | 11.22%(+1.12)#4,508 |
| 39. | Flat Rock | 12.29% | 1.83%(+10.5)#39 | 11.22%(+1.07)#4,523 |
| 40. | Holgate | 11.69% | 1.83%(+9.86)#40 | 11.22%(+0.467)#4,678 |
| 41. | Thornport | 11.63% | 1.83%(+9.81)#41 | 11.22%(+0.416)#4,696 |
| 42. | Hamler | 11.61% | 1.83%(+9.78)#42 | 11.22%(+0.393)#4,706 |
| 43. | Deshler | 11.32% | 1.83%(+9.49)#43 | 11.22%(+0.097)#4,802 |
| 44. | Archbold | 10.86% | 1.83%(+9.03)#44 | 11.22%(-0.361)#4,946 |
| 45. | Malinta | 10.81% | 1.83%(+8.98)#45 | 11.22%(-0.408)#4,958 |
| 46. | Freeport | 10.78% | 1.83%(+8.95)#46 | 11.22%(-0.443)#4,972 |
| 47. | Hicksville | 10.66% | 1.83%(+8.83)#47 | 11.22%(-0.558)#5,007 |
| 48. | Reno Beach | 10.54% | 1.83%(+8.71)#48 | 11.22%(-0.684)#5,059 |
| 49. | Defiance | 10.51% | 1.83%(+8.68)#49 | 11.22%(-0.710)#5,070 |
| 50. | Union City | 10.47% | 1.83%(+8.64)#50 | 11.22%(-0.748)#5,081 |
| 51. | Stony Ridge | 10.47% | 1.83%(+8.64)#51 | 11.22%(-0.749)#5,082 |
| 52. | Paulding | 10.45% | 1.83%(+8.62)#52 | 11.22%(-0.774)#5,093 |
| 53. | Kirby | 10.42% | 1.83%(+8.59)#53 | 11.22%(-0.802)#5,105 |
| 54. | West Unity | 10.17% | 1.83%(+8.34)#54 | 11.22%(-1.05)#5,182 |
| 55. | Cygnet | 10.02% | 1.83%(+8.19)#55 | 11.22%(-1.20)#5,242 |
| 56. | Custar | 9.92% | 1.83%(+8.09)#56 | 11.22%(-1.30)#5,286 |
| 57. | Ottawa | 9.76% | 1.83%(+7.93)#57 | 11.22%(-1.46)#5,345 |
| 58. | Harbor View | 9.68% | 1.83%(+7.85)#58 | 11.22%(-1.54)#5,380 |
| 59. | Ballville | 9.49% | 1.83%(+7.66)#59 | 11.22%(-1.73)#5,462 |
| 60. | Woodville | 9.47% | 1.83%(+7.64)#60 | 11.22%(-1.75)#5,469 |
| 61. | Miller | 9.35% | 1.83%(+7.52)#61 | 11.22%(-1.87)#5,517 |
| 62. | Neapolis | 9.09% | 1.83%(+7.26)#62 | 11.22%(-2.13)#5,619 |
| 63. | Broughton | 8.99% | 1.83%(+7.16)#63 | 11.22%(-2.23)#5,674 |
| 64. | Lincoln Village | 8.77% | 1.83%(+6.94)#64 | 11.22%(-2.45)#5,754 |
| 65. | Roachester | 8.68% | 1.83%(+6.85)#65 | 11.22%(-2.54)#5,808 |
| 66. | Tontogany | 8.54% | 1.83%(+6.71)#66 | 11.22%(-2.68)#5,871 |
| 67. | Clifton | 8.51% | 1.83%(+6.68)#67 | 11.22%(-2.71)#5,891 |
| 68. | Antioch | 8.51% | 1.83%(+6.68)#68 | 11.22%(-2.71)#5,893 |
| 69. | East Palestine | 8.45% | 1.83%(+6.62)#69 | 11.22%(-2.77)#5,918 |
| 70. | Ohio City | 8.41% | 1.83%(+6.58)#70 | 11.22%(-2.81)#5,945 |
| 71. | Rocky Ridge | 8.36% | 1.83%(+6.53)#71 | 11.22%(-2.86)#5,969 |
| 72. | Pettisville | 8.33% | 1.83%(+6.50)#72 | 11.22%(-2.89)#5,982 |
| 73. | St Paris | 8.33% | 1.83%(+6.50)#73 | 11.22%(-2.89)#5,989 |
| 74. | Gibsonburg | 8.28% | 1.83%(+6.45)#74 | 11.22%(-2.94)#6,018 |
| 75. | New Bloomington | 8.26% | 1.83%(+6.44)#75 | 11.22%(-2.95)#6,032 |
| 76. | Cecil | 8.09% | 1.83%(+6.26)#76 | 11.22%(-3.13)#6,125 |
| 77. | Nettle Lake | 8.06% | 1.83%(+6.24)#77 | 11.22%(-3.15)#6,141 |
| 78. | Oregon | 8.06% | 1.83%(+6.23)#78 | 11.22%(-3.16)#6,143 |
| 79. | Pemberville | 7.88% | 1.83%(+6.05)#79 | 11.22%(-3.34)#6,240 |
| 80. | Bloomingburg | 7.86% | 1.83%(+6.03)#80 | 11.22%(-3.36)#6,256 |
| 81. | Edon | 7.76% | 1.83%(+5.93)#81 | 11.22%(-3.46)#6,301 |
| 82. | West Alexandria | 7.70% | 1.83%(+5.87)#82 | 11.22%(-3.52)#6,335 |
| 83. | Tremont City | 7.64% | 1.83%(+5.81)#83 | 11.22%(-3.58)#6,366 |
| 84. | Mccomb | 7.59% | 1.83%(+5.77)#84 | 11.22%(-3.62)#6,398 |
| 85. | Morrow | 7.44% | 1.83%(+5.61)#85 | 11.22%(-3.78)#6,483 |
| 86. | Pandora | 7.37% | 1.83%(+5.54)#86 | 11.22%(-3.85)#6,523 |
| 87. | Mcclure | 7.33% | 1.83%(+5.50)#87 | 11.22%(-3.89)#6,540 |
| 88. | Port Clinton | 7.20% | 1.83%(+5.38)#88 | 11.22%(-4.01)#6,614 |
| 89. | Findlay | 7.00% | 1.83%(+5.18)#89 | 11.22%(-4.22)#6,727 |
| 90. | Wilmot | 6.99% | 1.83%(+5.16)#90 | 11.22%(-4.23)#6,736 |
| 91. | Grafton | 6.93% | 1.83%(+5.10)#91 | 11.22%(-4.29)#6,770 |
| 92. | Cairo | 6.82% | 1.83%(+4.99)#92 | 11.22%(-4.40)#6,834 |
| 93. | New Carlisle | 6.78% | 1.83%(+4.95)#93 | 11.22%(-4.44)#6,871 |
| 94. | Fayette | 6.63% | 1.83%(+4.80)#94 | 11.22%(-4.59)#6,971 |
| 95. | Toledo | 6.61% | 1.83%(+4.78)#95 | 11.22%(-4.61)#6,985 |
| 96. | Norwalk | 6.61% | 1.83%(+4.78)#96 | 11.22%(-4.61)#6,986 |
| 97. | Hamilton | 6.35% | 1.83%(+4.52)#97 | 11.22%(-4.87)#7,177 |
| 98. | Upper Sandusky | 6.24% | 1.83%(+4.41)#98 | 11.22%(-4.98)#7,268 |
| 99. | New Pittsburg | 6.23% | 1.83%(+4.40)#99 | 11.22%(-4.99)#7,280 |
| 100. | Helena | 6.20% | 1.83%(+4.38)#100 | 11.22%(-5.01)#7,296 |
Common Questions
What are the Top 10 Cities with the Highest Percentage of Mexican Population in Ohio?
Top 10 Cities with the Highest Percentage of Mexican Population in Ohio are:
#1
54.26%
#2
46.64%
#3
37.98%
#4
35.63%
#5
34.00%
#6
33.02%
#7
28.80%
#8
27.27%
#9
23.07%
#10
22.55%
What city has the Highest Percentage of Mexican Population in Ohio?
Belmore has the Highest Percentage of Mexican Population in Ohio with 54.26%.
What is the Percentage of Mexican Population in the State of Ohio?
Percentage of Mexican Population in Ohio is 1.83%.
What is the Percentage of Mexican Population in the United States?
Percentage of Mexican Population in the United States is 11.22%.