Cities with the Highest Percentage of Mexican Population in Delaware
RELATED REPORTS & OPTIONS
Mexican
Delaware
Compare Cities
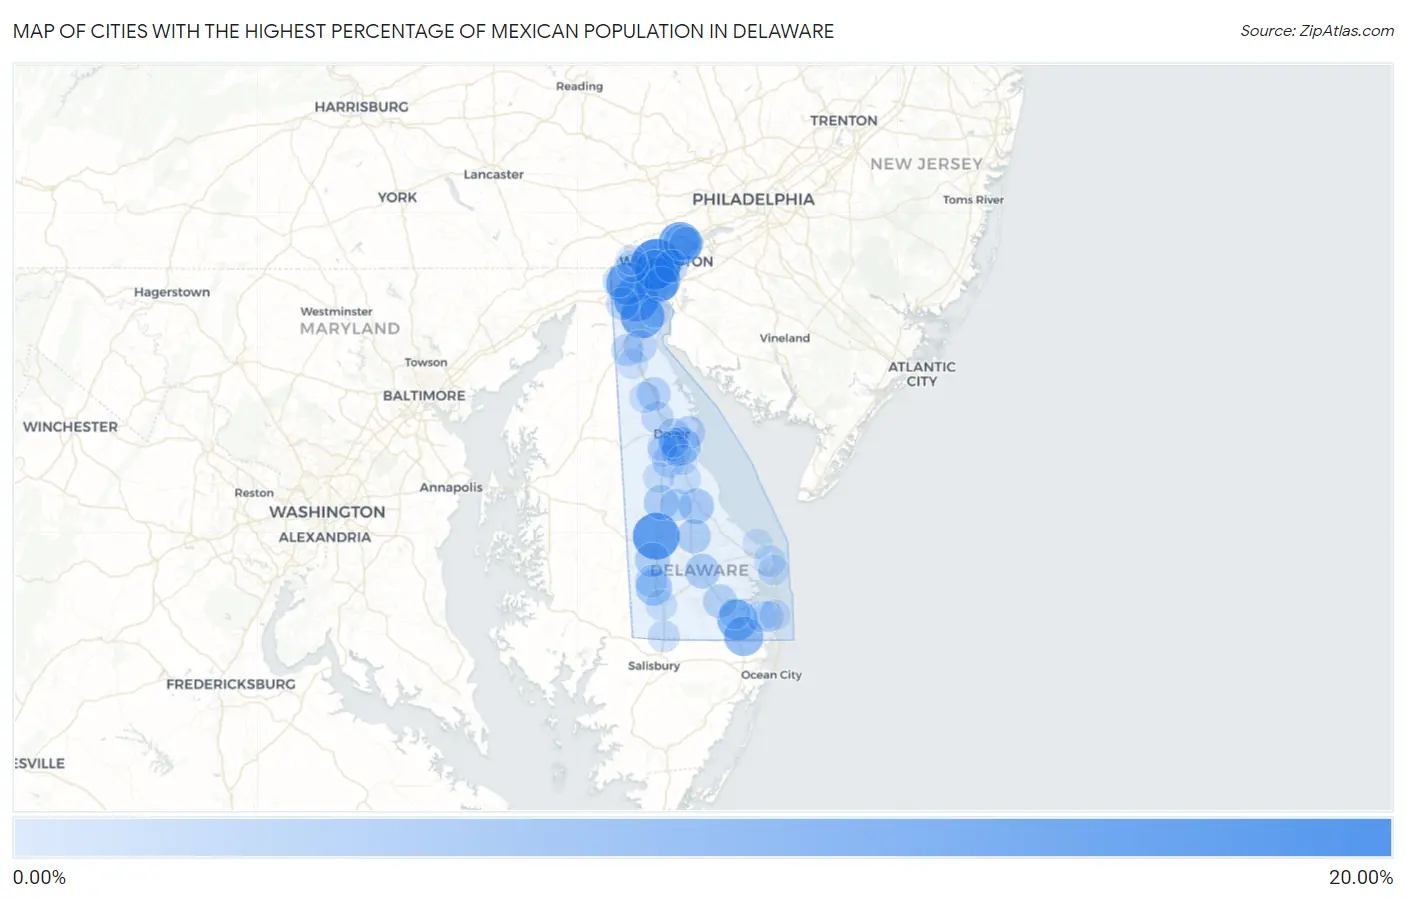
Map of Cities with the Highest Percentage of Mexican Population in Delaware
0.00%
20.00%
Cities with the Highest Percentage of Mexican Population in Delaware
| City | Mexican | vs State | vs National | |
| 1. | Elsmere | 17.94% | 3.52%(+14.4)#1 | 11.22%(+6.72)#3,358 |
| 2. | Greenwood | 15.36% | 3.52%(+11.8)#2 | 11.22%(+4.14)#3,815 |
| 3. | Wilmington Manor | 13.90% | 3.52%(+10.4)#3 | 11.22%(+2.68)#4,142 |
| 4. | Bear | 13.47% | 3.52%(+9.95)#4 | 11.22%(+2.25)#4,235 |
| 5. | St Georges | 12.50% | 3.52%(+8.98)#5 | 11.22%(+1.28)#4,465 |
| 6. | Ardencroft | 12.11% | 3.52%(+8.58)#6 | 11.22%(+0.886)#4,577 |
| 7. | Brookside | 11.31% | 3.52%(+7.79)#7 | 11.22%(+0.092)#4,805 |
| 8. | Newport | 9.52% | 3.52%(+6.00)#8 | 11.22%(-1.70)#5,453 |
| 9. | Frankford | 9.26% | 3.52%(+5.74)#9 | 11.22%(-1.96)#5,553 |
| 10. | Selbyville | 8.39% | 3.52%(+4.87)#10 | 11.22%(-2.83)#5,956 |
| 11. | Dover Base Housing | 7.23% | 3.52%(+3.71)#11 | 11.22%(-3.98)#6,595 |
| 12. | Blades | 5.63% | 3.52%(+2.10)#12 | 11.22%(-5.59)#7,746 |
| 13. | Ardentown | 5.38% | 3.52%(+1.86)#13 | 11.22%(-5.84)#7,966 |
| 14. | Milford | 4.93% | 3.52%(+1.41)#14 | 11.22%(-6.28)#8,415 |
| 15. | Georgetown | 4.33% | 3.52%(+0.810)#15 | 11.22%(-6.89)#9,082 |
| 16. | Harrington | 4.30% | 3.52%(+0.774)#16 | 11.22%(-6.92)#9,121 |
| 17. | Bridgeville | 4.29% | 3.52%(+0.763)#17 | 11.22%(-6.93)#9,133 |
| 18. | New Castle | 3.82% | 3.52%(+0.297)#18 | 11.22%(-7.40)#9,656 |
| 19. | Ellendale | 3.78% | 3.52%(+0.254)#19 | 11.22%(-7.44)#9,714 |
| 20. | Claymont | 3.65% | 3.52%(+0.127)#20 | 11.22%(-7.57)#9,894 |
| 21. | Millsboro | 3.40% | 3.52%(-0.120)#21 | 11.22%(-7.82)#10,256 |
| 22. | Smyrna | 3.15% | 3.52%(-0.368)#22 | 11.22%(-8.06)#10,650 |
| 23. | Dover | 2.89% | 3.52%(-0.637)#23 | 11.22%(-8.33)#11,132 |
| 24. | Wilmington | 2.62% | 3.52%(-0.903)#24 | 11.22%(-8.60)#11,640 |
| 25. | Glasgow | 2.60% | 3.52%(-0.920)#25 | 11.22%(-8.62)#11,679 |
| 26. | Little Creek | 2.57% | 3.52%(-0.949)#26 | 11.22%(-8.65)#11,737 |
| 27. | Odessa | 2.57% | 3.52%(-0.952)#27 | 11.22%(-8.65)#11,741 |
| 28. | Woodside East | 2.45% | 3.52%(-1.08)#28 | 11.22%(-8.77)#12,001 |
| 29. | Middletown | 2.24% | 3.52%(-1.29)#29 | 11.22%(-8.98)#12,462 |
| 30. | Seaford | 2.20% | 3.52%(-1.33)#30 | 11.22%(-9.02)#12,549 |
| 31. | Newark | 2.03% | 3.52%(-1.50)#31 | 11.22%(-9.19)#12,987 |
| 32. | Cheswold | 1.95% | 3.52%(-1.57)#32 | 11.22%(-9.27)#13,188 |
| 33. | Pike Creek Valley | 1.93% | 3.52%(-1.59)#33 | 11.22%(-9.29)#13,260 |
| 34. | Houston | 1.88% | 3.52%(-1.64)#34 | 11.22%(-9.34)#13,384 |
| 35. | Delmar | 1.75% | 3.52%(-1.77)#35 | 11.22%(-9.47)#13,684 |
| 36. | Millville | 1.46% | 3.52%(-2.06)#36 | 11.22%(-9.76)#14,496 |
| 37. | Rehoboth Beach | 1.40% | 3.52%(-2.12)#37 | 11.22%(-9.82)#14,669 |
| 38. | Camden | 1.33% | 3.52%(-2.19)#38 | 11.22%(-9.89)#14,896 |
| 39. | Frederica | 1.20% | 3.52%(-2.32)#39 | 11.22%(-10.0)#15,324 |
| 40. | Dagsboro | 1.12% | 3.52%(-2.40)#40 | 11.22%(-10.1)#15,585 |
| 41. | Laurel | 1.09% | 3.52%(-2.44)#41 | 11.22%(-10.1)#15,692 |
| 42. | Felton | 1.06% | 3.52%(-2.47)#42 | 11.22%(-10.2)#15,807 |
| 43. | Clayton | 0.98% | 3.52%(-2.54)#43 | 11.22%(-10.2)#16,118 |
| 44. | Bethany Beach | 0.94% | 3.52%(-2.58)#44 | 11.22%(-10.3)#16,262 |
| 45. | Ocean View | 0.75% | 3.52%(-2.77)#45 | 11.22%(-10.5)#17,014 |
| 46. | Highland Acres | 0.75% | 3.52%(-2.78)#46 | 11.22%(-10.5)#17,053 |
| 47. | Rising Sun Lebanon | 0.69% | 3.52%(-2.83)#47 | 11.22%(-10.5)#17,264 |
| 48. | Townsend | 0.62% | 3.52%(-2.90)#48 | 11.22%(-10.6)#17,531 |
| 49. | Dewey Beach | 0.56% | 3.52%(-2.97)#49 | 11.22%(-10.7)#17,819 |
| 50. | Wyoming | 0.53% | 3.52%(-2.99)#50 | 11.22%(-10.7)#17,922 |
| 51. | Pike Creek | 0.47% | 3.52%(-3.05)#51 | 11.22%(-10.7)#18,167 |
| 52. | Delaware City | 0.47% | 3.52%(-3.06)#52 | 11.22%(-10.8)#18,204 |
| 53. | Magnolia | 0.38% | 3.52%(-3.14)#53 | 11.22%(-10.8)#18,580 |
| 54. | Lewes | 0.30% | 3.52%(-3.22)#54 | 11.22%(-10.9)#18,951 |
| 55. | Kent Acres | 0.19% | 3.52%(-3.33)#55 | 11.22%(-11.0)#19,474 |
1
Common Questions
What are the Top 10 Cities with the Highest Percentage of Mexican Population in Delaware?
Top 10 Cities with the Highest Percentage of Mexican Population in Delaware are:
#1
17.94%
#2
15.36%
#3
13.90%
#4
13.47%
#5
12.50%
#6
12.11%
#7
11.31%
#8
9.52%
#9
9.26%
#10
8.39%
What city has the Highest Percentage of Mexican Population in Delaware?
Elsmere has the Highest Percentage of Mexican Population in Delaware with 17.94%.
What is the Percentage of Mexican Population in the State of Delaware?
Percentage of Mexican Population in Delaware is 3.52%.
What is the Percentage of Mexican Population in the United States?
Percentage of Mexican Population in the United States is 11.22%.