Cities with the Highest Percentage of Mexican Population in South Carolina
RELATED REPORTS & OPTIONS
Mexican
South Carolina
Compare Cities
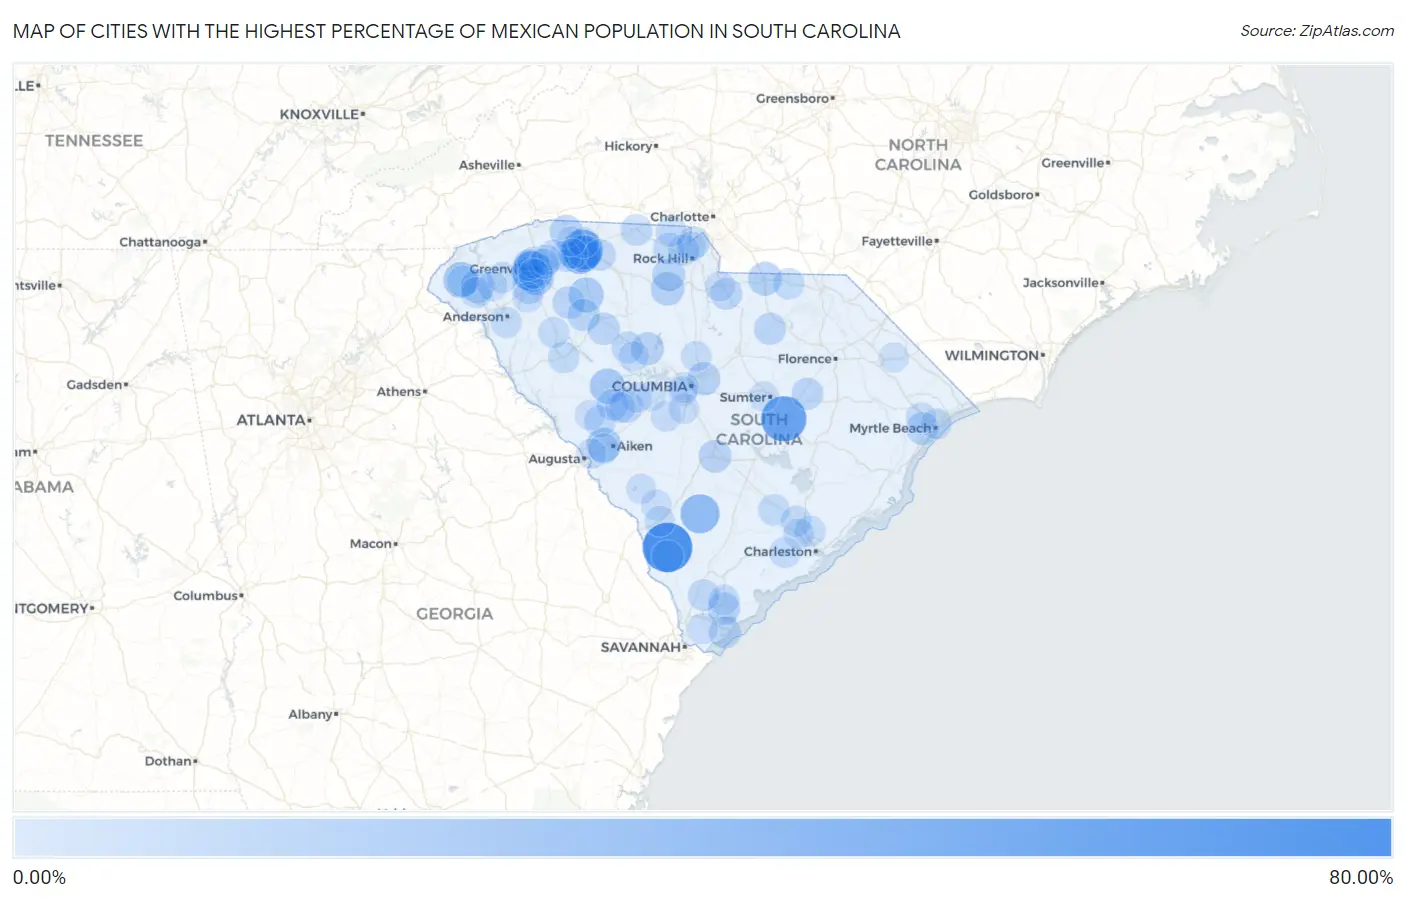
Map of Cities with the Highest Percentage of Mexican Population in South Carolina
0.00%
80.00%
Cities with the Highest Percentage of Mexican Population in South Carolina
| City | Mexican | vs State | vs National | |
| 1. | Luray | 62.50% | 3.05%(+59.4)#1 | 11.22%(+51.3)#838 |
| 2. | Alcolu | 49.09% | 3.05%(+46.0)#2 | 11.22%(+37.9)#1,170 |
| 3. | Southern Shops | 35.63% | 3.05%(+32.6)#3 | 11.22%(+24.4)#1,733 |
| 4. | Judson | 33.21% | 3.05%(+30.2)#4 | 11.22%(+22.0)#1,908 |
| 5. | Unity | 31.28% | 3.05%(+28.2)#5 | 11.22%(+20.1)#2,023 |
| 6. | Lodge | 30.00% | 3.05%(+26.9)#6 | 11.22%(+18.8)#2,122 |
| 7. | Fairforest | 27.49% | 3.05%(+24.4)#7 | 11.22%(+16.3)#2,326 |
| 8. | Arcadia | 23.61% | 3.05%(+20.6)#8 | 11.22%(+12.4)#2,676 |
| 9. | Walhalla | 20.53% | 3.05%(+17.5)#9 | 11.22%(+9.31)#2,998 |
| 10. | Arkwright | 19.00% | 3.05%(+16.0)#10 | 11.22%(+7.78)#3,211 |
| 11. | Saluda | 18.89% | 3.05%(+15.8)#11 | 11.22%(+7.67)#3,226 |
| 12. | Gantt | 18.74% | 3.05%(+15.7)#12 | 11.22%(+7.53)#3,245 |
| 13. | Enoree | 17.69% | 3.05%(+14.6)#13 | 11.22%(+6.47)#3,397 |
| 14. | Graniteville | 17.20% | 3.05%(+14.1)#14 | 11.22%(+5.98)#3,481 |
| 15. | Conestee | 16.75% | 3.05%(+13.7)#15 | 11.22%(+5.53)#3,569 |
| 16. | Saxon | 16.06% | 3.05%(+13.0)#16 | 11.22%(+4.84)#3,688 |
| 17. | Newry | 14.66% | 3.05%(+11.6)#17 | 11.22%(+3.44)#3,960 |
| 18. | Pageland | 14.56% | 3.05%(+11.5)#18 | 11.22%(+3.34)#3,986 |
| 19. | Gayle Mill | 13.77% | 3.05%(+10.7)#19 | 11.22%(+2.55)#4,163 |
| 20. | Welcome | 13.03% | 3.05%(+9.98)#20 | 11.22%(+1.81)#4,333 |
| 21. | Woodfield | 12.91% | 3.05%(+9.86)#21 | 11.22%(+1.69)#4,362 |
| 22. | Campobello | 12.24% | 3.05%(+9.19)#22 | 11.22%(+1.02)#4,537 |
| 23. | East Camden | 12.14% | 3.05%(+9.08)#23 | 11.22%(+0.918)#4,564 |
| 24. | Parker | 12.12% | 3.05%(+9.07)#24 | 11.22%(+0.902)#4,575 |
| 25. | Pomaria | 12.09% | 3.05%(+9.03)#25 | 11.22%(+0.869)#4,584 |
| 26. | Lowrys | 11.78% | 3.05%(+8.73)#26 | 11.22%(+0.565)#4,653 |
| 27. | Wilkinson Heights | 11.46% | 3.05%(+8.41)#27 | 11.22%(+0.245)#4,757 |
| 28. | Monetta | 11.41% | 3.05%(+8.36)#28 | 11.22%(+0.194)#4,772 |
| 29. | Port Royal | 11.39% | 3.05%(+8.34)#29 | 11.22%(+0.172)#4,779 |
| 30. | Gray Court | 10.80% | 3.05%(+7.74)#30 | 11.22%(-0.422)#4,965 |
| 31. | Socastee | 10.71% | 3.05%(+7.66)#31 | 11.22%(-0.509)#4,993 |
| 32. | Piedmont | 10.71% | 3.05%(+7.65)#32 | 11.22%(-0.511)#4,995 |
| 33. | Watts Mills | 10.63% | 3.05%(+7.58)#33 | 11.22%(-0.588)#5,018 |
| 34. | Joanna | 10.38% | 3.05%(+7.33)#34 | 11.22%(-0.835)#5,118 |
| 35. | Estill | 9.60% | 3.05%(+6.54)#35 | 11.22%(-1.62)#5,412 |
| 36. | Bethune | 9.47% | 3.05%(+6.42)#36 | 11.22%(-1.75)#5,465 |
| 37. | Hilton Head Island | 9.41% | 3.05%(+6.36)#37 | 11.22%(-1.81)#5,494 |
| 38. | Sandy Springs | 9.39% | 3.05%(+6.34)#38 | 11.22%(-1.83)#5,500 |
| 39. | Tega Cay | 9.34% | 3.05%(+6.29)#39 | 11.22%(-1.88)#5,520 |
| 40. | Shiloh | 9.23% | 3.05%(+6.18)#40 | 11.22%(-1.99)#5,568 |
| 41. | Elgin | 9.06% | 3.05%(+6.00)#41 | 11.22%(-2.16)#5,640 |
| 42. | Newberry | 8.94% | 3.05%(+5.89)#42 | 11.22%(-2.28)#5,690 |
| 43. | Blacksburg | 8.89% | 3.05%(+5.84)#43 | 11.22%(-2.33)#5,710 |
| 44. | Ridgeland | 8.80% | 3.05%(+5.75)#44 | 11.22%(-2.42)#5,742 |
| 45. | Sans Souci | 8.52% | 3.05%(+5.46)#45 | 11.22%(-2.70)#5,887 |
| 46. | Trenton | 8.41% | 3.05%(+5.36)#46 | 11.22%(-2.80)#5,943 |
| 47. | Ward | 8.33% | 3.05%(+5.28)#47 | 11.22%(-2.89)#5,983 |
| 48. | Glendale | 8.27% | 3.05%(+5.21)#48 | 11.22%(-2.95)#6,030 |
| 49. | York | 8.05% | 3.05%(+5.00)#49 | 11.22%(-3.17)#6,153 |
| 50. | Berea | 7.90% | 3.05%(+4.84)#50 | 11.22%(-3.32)#6,231 |
| 51. | Ridgeville | 7.88% | 3.05%(+4.83)#51 | 11.22%(-3.34)#6,239 |
| 52. | Ruby | 7.52% | 3.05%(+4.47)#52 | 11.22%(-3.70)#6,433 |
| 53. | Newport | 7.41% | 3.05%(+4.35)#53 | 11.22%(-3.81)#6,505 |
| 54. | Greenwood | 7.40% | 3.05%(+4.34)#54 | 11.22%(-3.82)#6,511 |
| 55. | West Union | 7.35% | 3.05%(+4.29)#55 | 11.22%(-3.87)#6,535 |
| 56. | Utica | 7.26% | 3.05%(+4.20)#56 | 11.22%(-3.96)#6,584 |
| 57. | Ravenel | 7.00% | 3.05%(+3.95)#57 | 11.22%(-4.22)#6,732 |
| 58. | Greer | 6.98% | 3.05%(+3.93)#58 | 11.22%(-4.24)#6,739 |
| 59. | Hanahan | 6.75% | 3.05%(+3.70)#59 | 11.22%(-4.47)#6,886 |
| 60. | Ware Shoals | 6.72% | 3.05%(+3.67)#60 | 11.22%(-4.50)#6,905 |
| 61. | Liberty | 6.70% | 3.05%(+3.65)#61 | 11.22%(-4.52)#6,924 |
| 62. | Duncan | 6.64% | 3.05%(+3.58)#62 | 11.22%(-4.58)#6,963 |
| 63. | Myrtle Beach | 6.46% | 3.05%(+3.41)#63 | 11.22%(-4.76)#7,090 |
| 64. | Ladson | 6.32% | 3.05%(+3.27)#64 | 11.22%(-4.90)#7,205 |
| 65. | Homeland Park | 6.31% | 3.05%(+3.25)#65 | 11.22%(-4.91)#7,216 |
| 66. | Burton | 6.22% | 3.05%(+3.17)#66 | 11.22%(-5.00)#7,287 |
| 67. | Clover | 6.09% | 3.05%(+3.03)#67 | 11.22%(-5.13)#7,373 |
| 68. | Hilltop | 5.96% | 3.05%(+2.91)#68 | 11.22%(-5.26)#7,471 |
| 69. | Batesburg Leesville | 5.92% | 3.05%(+2.86)#69 | 11.22%(-5.30)#7,515 |
| 70. | Ridge Spring | 5.83% | 3.05%(+2.78)#70 | 11.22%(-5.39)#7,570 |
| 71. | Taylors | 5.78% | 3.05%(+2.73)#71 | 11.22%(-5.44)#7,608 |
| 72. | North Charleston | 5.75% | 3.05%(+2.70)#72 | 11.22%(-5.47)#7,634 |
| 73. | Boiling Springs | 5.73% | 3.05%(+2.67)#73 | 11.22%(-5.49)#7,655 |
| 74. | Warrenville | 5.73% | 3.05%(+2.67)#74 | 11.22%(-5.49)#7,659 |
| 75. | Bluffton | 5.72% | 3.05%(+2.67)#75 | 11.22%(-5.50)#7,661 |
| 76. | Pelion | 5.68% | 3.05%(+2.63)#76 | 11.22%(-5.54)#7,704 |
| 77. | Kline | 5.64% | 3.05%(+2.59)#77 | 11.22%(-5.58)#7,738 |
| 78. | Red Hill | 5.51% | 3.05%(+2.45)#78 | 11.22%(-5.71)#7,861 |
| 79. | Blythewood | 5.30% | 3.05%(+2.24)#79 | 11.22%(-5.92)#8,056 |
| 80. | Gaston | 5.27% | 3.05%(+2.22)#80 | 11.22%(-5.95)#8,077 |
| 81. | Allendale | 5.26% | 3.05%(+2.20)#81 | 11.22%(-5.96)#8,099 |
| 82. | West Pelzer | 5.02% | 3.05%(+1.97)#82 | 11.22%(-6.20)#8,328 |
| 83. | Edgefield | 4.99% | 3.05%(+1.94)#83 | 11.22%(-6.23)#8,356 |
| 84. | West Columbia | 4.99% | 3.05%(+1.94)#84 | 11.22%(-6.23)#8,361 |
| 85. | Sumter | 4.77% | 3.05%(+1.72)#85 | 11.22%(-6.45)#8,587 |
| 86. | Whitney | 4.71% | 3.05%(+1.66)#86 | 11.22%(-6.51)#8,654 |
| 87. | Wade Hampton | 4.60% | 3.05%(+1.55)#87 | 11.22%(-6.62)#8,787 |
| 88. | Snelling | 4.58% | 3.05%(+1.53)#88 | 11.22%(-6.64)#8,806 |
| 89. | Lancaster | 4.45% | 3.05%(+1.39)#89 | 11.22%(-6.77)#8,955 |
| 90. | The Cliffs Valley | 4.39% | 3.05%(+1.34)#90 | 11.22%(-6.82)#9,016 |
| 91. | Springdale | 4.28% | 3.05%(+1.23)#91 | 11.22%(-6.94)#9,147 |
| 92. | Prosperity | 4.21% | 3.05%(+1.16)#92 | 11.22%(-7.00)#9,215 |
| 93. | Clearwater | 4.20% | 3.05%(+1.15)#93 | 11.22%(-7.02)#9,233 |
| 94. | Dunean | 4.09% | 3.05%(+1.03)#94 | 11.22%(-7.13)#9,361 |
| 95. | Inman | 4.02% | 3.05%(+0.964)#95 | 11.22%(-7.20)#9,439 |
| 96. | Mullins | 3.89% | 3.05%(+0.833)#96 | 11.22%(-7.33)#9,585 |
| 97. | India Hook | 3.81% | 3.05%(+0.755)#97 | 11.22%(-7.41)#9,678 |
| 98. | Gilbert | 3.73% | 3.05%(+0.677)#98 | 11.22%(-7.49)#9,777 |
| 99. | Central | 3.62% | 3.05%(+0.570)#99 | 11.22%(-7.60)#9,936 |
| 100. | Wellford | 3.60% | 3.05%(+0.550)#100 | 11.22%(-7.62)#9,965 |
Common Questions
What are the Top 10 Cities with the Highest Percentage of Mexican Population in South Carolina?
Top 10 Cities with the Highest Percentage of Mexican Population in South Carolina are:
#1
62.50%
#2
49.09%
#3
35.63%
#4
33.21%
#5
30.00%
#6
27.49%
#7
23.61%
#8
20.53%
#9
18.89%
#10
18.74%
What city has the Highest Percentage of Mexican Population in South Carolina?
Luray has the Highest Percentage of Mexican Population in South Carolina with 62.50%.
What is the Percentage of Mexican Population in the State of South Carolina?
Percentage of Mexican Population in South Carolina is 3.05%.
What is the Percentage of Mexican Population in the United States?
Percentage of Mexican Population in the United States is 11.22%.