Cities with the Highest Percentage of Mexican Population in Kentucky
RELATED REPORTS & OPTIONS
Mexican
Kentucky
Compare Cities
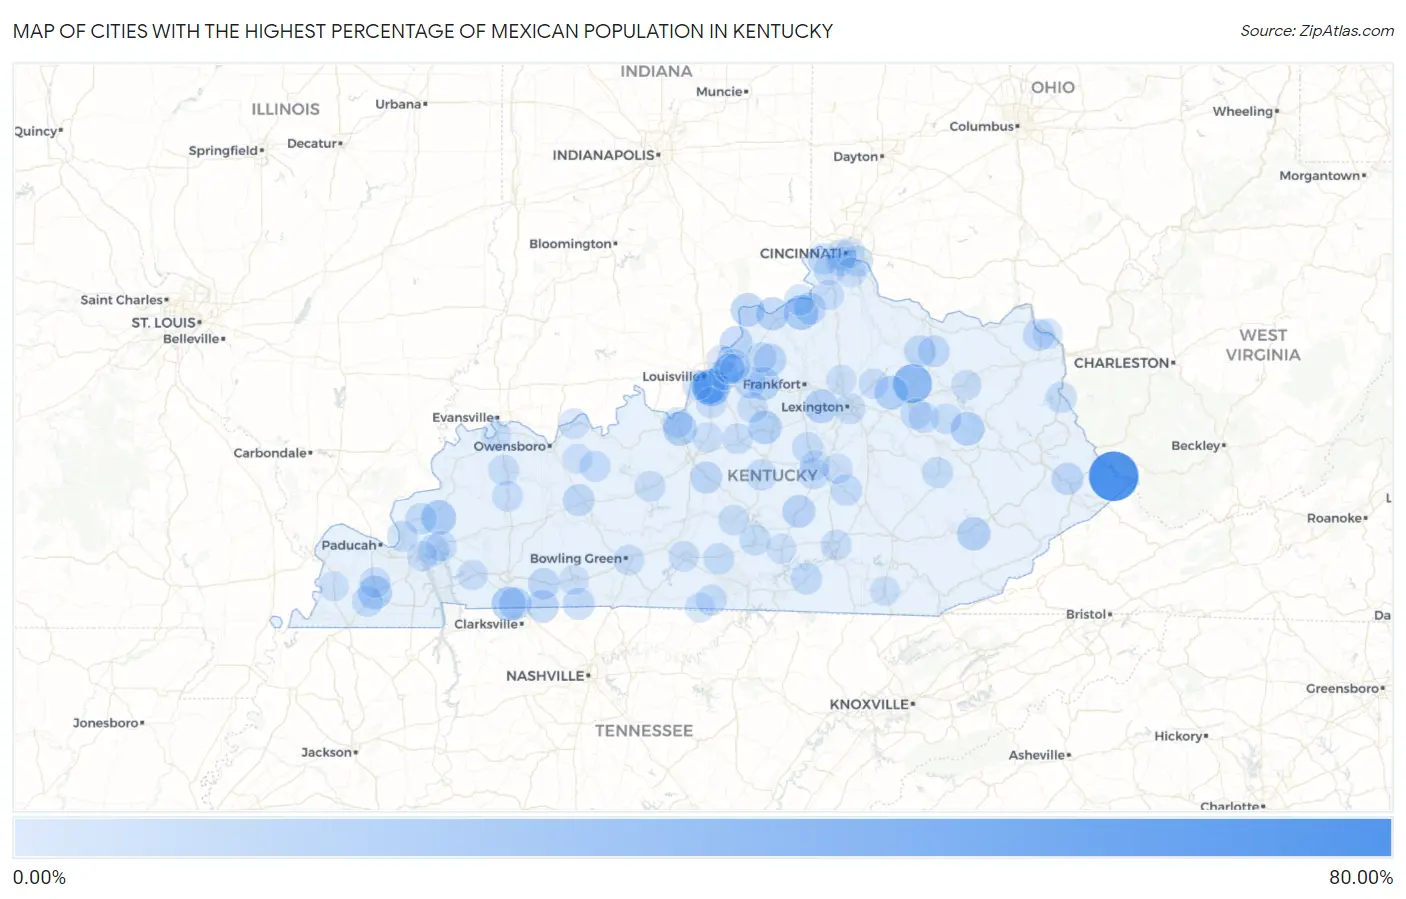
Map of Cities with the Highest Percentage of Mexican Population in Kentucky
0.00%
80.00%
Cities with the Highest Percentage of Mexican Population in Kentucky
| City | Mexican | vs State | vs National | |
| 1. | Freeburn | 60.36% | 2.08%(+58.3)#1 | 11.22%(+49.1)#887 |
| 2. | Sharpsburg | 28.74% | 2.08%(+26.7)#2 | 11.22%(+17.5)#2,209 |
| 3. | Poplar Hills | 23.70% | 2.08%(+21.6)#3 | 11.22%(+12.5)#2,663 |
| 4. | Crayne | 15.75% | 2.08%(+13.7)#4 | 11.22%(+4.53)#3,740 |
| 5. | Sparta | 15.66% | 2.08%(+13.6)#5 | 11.22%(+4.44)#3,753 |
| 6. | Fort Campbell North | 14.78% | 2.08%(+12.7)#6 | 11.22%(+3.56)#3,927 |
| 7. | Watterson Park | 14.00% | 2.08%(+11.9)#7 | 11.22%(+2.78)#4,119 |
| 8. | Fort Knox | 13.48% | 2.08%(+11.4)#8 | 11.22%(+2.26)#4,231 |
| 9. | Ezel | 12.92% | 2.08%(+10.8)#9 | 11.22%(+1.70)#4,357 |
| 10. | Mayfield | 12.83% | 2.08%(+10.7)#10 | 11.22%(+1.61)#4,384 |
| 11. | North Middletown | 12.79% | 2.08%(+10.7)#11 | 11.22%(+1.57)#4,395 |
| 12. | Milton | 12.64% | 2.08%(+10.6)#12 | 11.22%(+1.42)#4,436 |
| 13. | Versailles | 12.63% | 2.08%(+10.6)#13 | 11.22%(+1.42)#4,437 |
| 14. | Lynnview | 12.48% | 2.08%(+10.4)#14 | 11.22%(+1.26)#4,470 |
| 15. | Chaplin | 11.94% | 2.08%(+9.86)#15 | 11.22%(+0.721)#4,625 |
| 16. | Hyden | 11.88% | 2.08%(+9.81)#16 | 11.22%(+0.664)#4,636 |
| 17. | Carrollton | 11.57% | 2.08%(+9.49)#17 | 11.22%(+0.352)#4,719 |
| 18. | Liberty | 10.35% | 2.08%(+8.27)#18 | 11.22%(-0.868)#5,123 |
| 19. | Westport | 10.19% | 2.08%(+8.12)#19 | 11.22%(-1.02)#5,172 |
| 20. | Shelbyville | 10.18% | 2.08%(+8.10)#20 | 11.22%(-1.04)#5,179 |
| 21. | Eminence | 9.61% | 2.08%(+7.53)#21 | 11.22%(-1.61)#5,406 |
| 22. | Oak Grove | 9.55% | 2.08%(+7.47)#22 | 11.22%(-1.67)#5,437 |
| 23. | Guthrie | 9.12% | 2.08%(+7.05)#23 | 11.22%(-2.10)#5,609 |
| 24. | Yelvington | 9.01% | 2.08%(+6.93)#24 | 11.22%(-2.21)#5,668 |
| 25. | Crestwood | 8.55% | 2.08%(+6.47)#25 | 11.22%(-2.67)#5,867 |
| 26. | Glencoe | 8.26% | 2.08%(+6.18)#26 | 11.22%(-2.96)#6,033 |
| 27. | Coal Run Village | 8.23% | 2.08%(+6.15)#27 | 11.22%(-2.99)#6,053 |
| 28. | Hodgenville | 7.96% | 2.08%(+5.88)#28 | 11.22%(-3.26)#6,206 |
| 29. | Adairville | 7.90% | 2.08%(+5.82)#29 | 11.22%(-3.32)#6,230 |
| 30. | Simpsonville | 7.73% | 2.08%(+5.65)#30 | 11.22%(-3.49)#6,326 |
| 31. | Ewing | 7.66% | 2.08%(+5.59)#31 | 11.22%(-3.56)#6,357 |
| 32. | Beaver Dam | 7.64% | 2.08%(+5.56)#32 | 11.22%(-3.58)#6,371 |
| 33. | Greenup | 7.58% | 2.08%(+5.51)#33 | 11.22%(-3.63)#6,403 |
| 34. | Elkton | 7.22% | 2.08%(+5.14)#34 | 11.22%(-4.00)#6,605 |
| 35. | Flemingsburg | 7.21% | 2.08%(+5.13)#35 | 11.22%(-4.01)#6,610 |
| 36. | Crab Orchard | 6.66% | 2.08%(+4.58)#36 | 11.22%(-4.56)#6,944 |
| 37. | Monticello | 6.45% | 2.08%(+4.37)#37 | 11.22%(-4.77)#7,107 |
| 38. | Hebron | 6.39% | 2.08%(+4.31)#38 | 11.22%(-4.83)#7,147 |
| 39. | Salem | 6.37% | 2.08%(+4.29)#39 | 11.22%(-4.85)#7,157 |
| 40. | Pryorsburg | 5.92% | 2.08%(+3.84)#40 | 11.22%(-5.30)#7,506 |
| 41. | Smithland | 5.84% | 2.08%(+3.76)#41 | 11.22%(-5.38)#7,565 |
| 42. | Silver Grove | 5.77% | 2.08%(+3.69)#42 | 11.22%(-5.45)#7,619 |
| 43. | Junction City | 5.68% | 2.08%(+3.60)#43 | 11.22%(-5.54)#7,706 |
| 44. | Warsaw | 5.64% | 2.08%(+3.57)#44 | 11.22%(-5.58)#7,736 |
| 45. | Camargo | 5.60% | 2.08%(+3.52)#45 | 11.22%(-5.62)#7,774 |
| 46. | Beattyville | 5.57% | 2.08%(+3.50)#46 | 11.22%(-5.65)#7,801 |
| 47. | Louisa | 5.54% | 2.08%(+3.47)#47 | 11.22%(-5.68)#7,829 |
| 48. | Lebanon | 5.40% | 2.08%(+3.33)#48 | 11.22%(-5.82)#7,941 |
| 49. | Harrodsburg | 5.34% | 2.08%(+3.27)#49 | 11.22%(-5.88)#8,007 |
| 50. | Fordsville | 5.31% | 2.08%(+3.23)#50 | 11.22%(-5.91)#8,036 |
| 51. | Columbia | 5.22% | 2.08%(+3.14)#51 | 11.22%(-6.00)#8,137 |
| 52. | Edmonton | 5.22% | 2.08%(+3.14)#52 | 11.22%(-6.00)#8,138 |
| 53. | Kuttawa | 5.14% | 2.08%(+3.07)#53 | 11.22%(-6.07)#8,197 |
| 54. | Clarkson | 5.01% | 2.08%(+2.93)#54 | 11.22%(-6.21)#8,340 |
| 55. | Tompkinsville | 5.00% | 2.08%(+2.92)#55 | 11.22%(-6.22)#8,344 |
| 56. | Sebree | 4.95% | 2.08%(+2.87)#56 | 11.22%(-6.27)#8,402 |
| 57. | Hanson | 4.93% | 2.08%(+2.85)#57 | 11.22%(-6.29)#8,420 |
| 58. | Bowling Green | 4.92% | 2.08%(+2.84)#58 | 11.22%(-6.30)#8,426 |
| 59. | Jeffersonville | 4.91% | 2.08%(+2.83)#59 | 11.22%(-6.31)#8,436 |
| 60. | Lexington | 4.87% | 2.08%(+2.80)#60 | 11.22%(-6.35)#8,478 |
| 61. | Smithfield | 4.84% | 2.08%(+2.76)#61 | 11.22%(-6.38)#8,506 |
| 62. | Ludlow | 4.72% | 2.08%(+2.64)#62 | 11.22%(-6.50)#8,648 |
| 63. | Taylorsville | 4.60% | 2.08%(+2.52)#63 | 11.22%(-6.62)#8,788 |
| 64. | Hunters Hollow | 4.59% | 2.08%(+2.51)#64 | 11.22%(-6.63)#8,796 |
| 65. | Somerset | 4.52% | 2.08%(+2.44)#65 | 11.22%(-6.70)#8,885 |
| 66. | Bardstown | 4.50% | 2.08%(+2.42)#66 | 11.22%(-6.72)#8,906 |
| 67. | Hickory | 4.35% | 2.08%(+2.27)#67 | 11.22%(-6.87)#9,058 |
| 68. | Glasgow | 4.34% | 2.08%(+2.26)#68 | 11.22%(-6.88)#9,070 |
| 69. | Greensburg | 4.33% | 2.08%(+2.26)#69 | 11.22%(-6.88)#9,081 |
| 70. | Frenchburg | 4.23% | 2.08%(+2.15)#70 | 11.22%(-6.99)#9,201 |
| 71. | Eddyville | 4.13% | 2.08%(+2.06)#71 | 11.22%(-7.09)#9,307 |
| 72. | Muldraugh | 4.10% | 2.08%(+2.02)#72 | 11.22%(-7.12)#9,351 |
| 73. | Cadiz | 4.09% | 2.08%(+2.01)#73 | 11.22%(-7.13)#9,358 |
| 74. | Fincastle | 4.08% | 2.08%(+2.00)#74 | 11.22%(-7.14)#9,367 |
| 75. | Lewisport | 3.94% | 2.08%(+1.87)#75 | 11.22%(-7.27)#9,507 |
| 76. | Lyndon | 3.80% | 2.08%(+1.72)#76 | 11.22%(-7.42)#9,685 |
| 77. | Florence | 3.77% | 2.08%(+1.69)#77 | 11.22%(-7.45)#9,723 |
| 78. | Paris | 3.70% | 2.08%(+1.62)#78 | 11.22%(-7.52)#9,825 |
| 79. | Morehead | 3.64% | 2.08%(+1.57)#79 | 11.22%(-7.58)#9,906 |
| 80. | Lancaster | 3.55% | 2.08%(+1.47)#80 | 11.22%(-7.67)#10,044 |
| 81. | Grand Rivers | 3.47% | 2.08%(+1.40)#81 | 11.22%(-7.75)#10,162 |
| 82. | Worthington | 3.43% | 2.08%(+1.35)#82 | 11.22%(-7.79)#10,228 |
| 83. | Verona | 3.32% | 2.08%(+1.24)#83 | 11.22%(-7.90)#10,393 |
| 84. | Henderson | 3.16% | 2.08%(+1.09)#84 | 11.22%(-8.06)#10,622 |
| 85. | Georgetown | 3.10% | 2.08%(+1.02)#85 | 11.22%(-8.12)#10,732 |
| 86. | Russell Springs | 3.10% | 2.08%(+1.02)#86 | 11.22%(-8.12)#10,742 |
| 87. | River Bluff | 3.02% | 2.08%(+0.947)#87 | 11.22%(-8.19)#10,866 |
| 88. | Gamaliel | 3.02% | 2.08%(+0.946)#88 | 11.22%(-8.20)#10,868 |
| 89. | Danville | 3.00% | 2.08%(+0.925)#89 | 11.22%(-8.22)#10,912 |
| 90. | Worthington Hills | 2.89% | 2.08%(+0.812)#90 | 11.22%(-8.33)#11,123 |
| 91. | Lebanon Junction | 2.87% | 2.08%(+0.794)#91 | 11.22%(-8.35)#11,160 |
| 92. | Russellville | 2.84% | 2.08%(+0.762)#92 | 11.22%(-8.38)#11,206 |
| 93. | Fort Mitchell | 2.84% | 2.08%(+0.761)#93 | 11.22%(-8.38)#11,207 |
| 94. | Bellevue | 2.72% | 2.08%(+0.639)#94 | 11.22%(-8.50)#11,423 |
| 95. | Pewee Valley | 2.71% | 2.08%(+0.631)#95 | 11.22%(-8.51)#11,438 |
| 96. | Ryland Heights | 2.70% | 2.08%(+0.626)#96 | 11.22%(-8.52)#11,449 |
| 97. | Shively | 2.67% | 2.08%(+0.590)#97 | 11.22%(-8.55)#11,531 |
| 98. | Williamsburg | 2.64% | 2.08%(+0.562)#98 | 11.22%(-8.58)#11,597 |
| 99. | Whitesville | 2.63% | 2.08%(+0.555)#99 | 11.22%(-8.59)#11,610 |
| 100. | Arlington | 2.63% | 2.08%(+0.555)#100 | 11.22%(-8.59)#11,612 |
Common Questions
What are the Top 10 Cities with the Highest Percentage of Mexican Population in Kentucky?
Top 10 Cities with the Highest Percentage of Mexican Population in Kentucky are:
#1
60.36%
#2
28.74%
#3
23.70%
#4
15.75%
#5
15.66%
#6
14.78%
#7
14.00%
#8
13.48%
#9
12.92%
#10
12.83%
What city has the Highest Percentage of Mexican Population in Kentucky?
Freeburn has the Highest Percentage of Mexican Population in Kentucky with 60.36%.
What is the Percentage of Mexican Population in the State of Kentucky?
Percentage of Mexican Population in Kentucky is 2.08%.
What is the Percentage of Mexican Population in the United States?
Percentage of Mexican Population in the United States is 11.22%.