Cities with the Highest Percentage of Mexican Population in Maryland
RELATED REPORTS & OPTIONS
Mexican
Maryland
Compare Cities
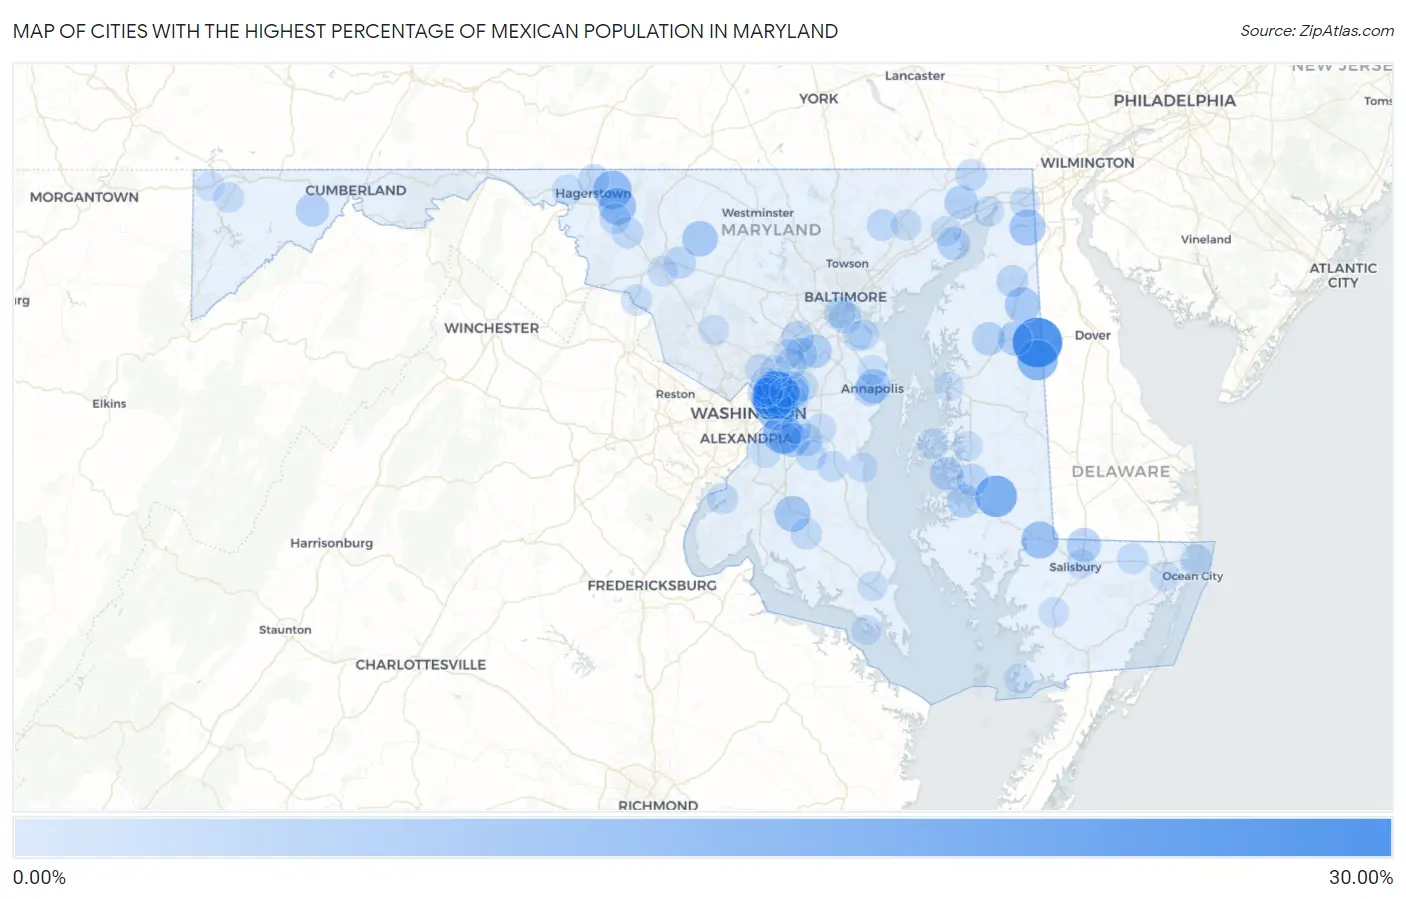
Map of Cities with the Highest Percentage of Mexican Population in Maryland
0.00%
30.00%
Cities with the Highest Percentage of Mexican Population in Maryland
| City | Mexican | vs State | vs National | |
| 1. | Templeville | 29.67% | 1.74%(+27.9)#1 | 11.22%(+18.5)#2,150 |
| 2. | East Riverdale | 21.58% | 1.74%(+19.8)#2 | 11.22%(+10.4)#2,885 |
| 3. | Riverdale Park | 20.37% | 1.74%(+18.6)#3 | 11.22%(+9.15)#3,023 |
| 4. | Graceham | 19.70% | 1.74%(+18.0)#4 | 11.22%(+8.49)#3,114 |
| 5. | Secretary | 18.38% | 1.74%(+16.6)#5 | 11.22%(+7.16)#3,292 |
| 6. | Bladensburg | 17.77% | 1.74%(+16.0)#6 | 11.22%(+6.55)#3,384 |
| 7. | Edmonston | 16.90% | 1.74%(+15.2)#7 | 11.22%(+5.69)#3,542 |
| 8. | Henderson | 16.78% | 1.74%(+15.0)#8 | 11.22%(+5.56)#3,565 |
| 9. | Morningside | 15.07% | 1.74%(+13.3)#9 | 11.22%(+3.85)#3,868 |
| 10. | Chewsville | 14.12% | 1.74%(+12.4)#10 | 11.22%(+2.90)#4,088 |
| 11. | Fairmount Heights | 14.03% | 1.74%(+12.3)#11 | 11.22%(+2.81)#4,107 |
| 12. | Mount Aetna | 12.16% | 1.74%(+10.4)#12 | 11.22%(+0.943)#4,555 |
| 13. | Mardela Springs | 12.10% | 1.74%(+10.4)#13 | 11.22%(+0.879)#4,580 |
| 14. | Woodlawn Cdp Prince George S County | 12.00% | 1.74%(+10.3)#14 | 11.22%(+0.784)#4,603 |
| 15. | Chesapeake City | 10.61% | 1.74%(+8.87)#15 | 11.22%(-0.607)#5,023 |
| 16. | Bryantown | 10.48% | 1.74%(+8.74)#16 | 11.22%(-0.735)#5,078 |
| 17. | Libertytown | 9.96% | 1.74%(+8.22)#17 | 11.22%(-1.26)#5,271 |
| 18. | Millington | 9.79% | 1.74%(+8.05)#18 | 11.22%(-1.43)#5,333 |
| 19. | Colmar Manor | 8.44% | 1.74%(+6.70)#19 | 11.22%(-2.78)#5,919 |
| 20. | Melwood | 8.38% | 1.74%(+6.64)#20 | 11.22%(-2.84)#5,963 |
| 21. | Seabrook | 8.21% | 1.74%(+6.47)#21 | 11.22%(-3.01)#6,058 |
| 22. | Delmar | 8.19% | 1.74%(+6.45)#22 | 11.22%(-3.03)#6,072 |
| 23. | Naval Academy | 8.18% | 1.74%(+6.44)#23 | 11.22%(-3.03)#6,074 |
| 24. | Barclay | 8.00% | 1.74%(+6.26)#24 | 11.22%(-3.22)#6,179 |
| 25. | Port Deposit | 7.67% | 1.74%(+5.93)#25 | 11.22%(-3.55)#6,356 |
| 26. | Brentwood | 7.62% | 1.74%(+5.87)#26 | 11.22%(-3.60)#6,380 |
| 27. | Fort Meade | 7.51% | 1.74%(+5.77)#27 | 11.22%(-3.71)#6,441 |
| 28. | Algonquin | 7.30% | 1.74%(+5.56)#28 | 11.22%(-3.92)#6,552 |
| 29. | Church Hill | 7.20% | 1.74%(+5.46)#29 | 11.22%(-4.02)#6,617 |
| 30. | Gilmore | 6.96% | 1.74%(+5.22)#30 | 11.22%(-4.26)#6,747 |
| 31. | Oxford | 6.85% | 1.74%(+5.11)#31 | 11.22%(-4.36)#6,817 |
| 32. | Aberdeen Proving Ground | 6.47% | 1.74%(+4.73)#32 | 11.22%(-4.74)#7,080 |
| 33. | Wildewood | 6.39% | 1.74%(+4.65)#33 | 11.22%(-4.83)#7,146 |
| 34. | Cottage City | 6.37% | 1.74%(+4.63)#34 | 11.22%(-4.85)#7,160 |
| 35. | Savage | 6.31% | 1.74%(+4.57)#35 | 11.22%(-4.91)#7,215 |
| 36. | Landover Hills | 6.19% | 1.74%(+4.44)#36 | 11.22%(-5.03)#7,308 |
| 37. | Lanham | 6.14% | 1.74%(+4.40)#37 | 11.22%(-5.08)#7,337 |
| 38. | Queensland | 6.00% | 1.74%(+4.26)#38 | 11.22%(-5.22)#7,439 |
| 39. | Landover | 5.98% | 1.74%(+4.24)#39 | 11.22%(-5.24)#7,455 |
| 40. | Trappe | 5.79% | 1.74%(+4.05)#40 | 11.22%(-5.43)#7,600 |
| 41. | Annapolis | 5.77% | 1.74%(+4.03)#41 | 11.22%(-5.45)#7,616 |
| 42. | Brooklyn Park | 5.65% | 1.74%(+3.91)#42 | 11.22%(-5.57)#7,729 |
| 43. | Galena | 5.60% | 1.74%(+3.86)#43 | 11.22%(-5.62)#7,777 |
| 44. | Spring Ridge | 5.46% | 1.74%(+3.72)#44 | 11.22%(-5.75)#7,891 |
| 45. | Maryland City | 5.40% | 1.74%(+3.66)#45 | 11.22%(-5.82)#7,949 |
| 46. | Andrews Afb | 5.36% | 1.74%(+3.62)#46 | 11.22%(-5.86)#7,989 |
| 47. | Baltimore Highlands | 5.25% | 1.74%(+3.51)#47 | 11.22%(-5.97)#8,104 |
| 48. | Ocean City | 5.10% | 1.74%(+3.36)#48 | 11.22%(-6.12)#8,240 |
| 49. | Rising Sun | 5.08% | 1.74%(+3.34)#49 | 11.22%(-6.14)#8,266 |
| 50. | Myersville | 4.93% | 1.74%(+3.19)#50 | 11.22%(-6.29)#8,416 |
| 51. | Fountainhead Orchard Hills | 4.79% | 1.74%(+3.05)#51 | 11.22%(-6.43)#8,559 |
| 52. | Springdale | 4.69% | 1.74%(+2.95)#52 | 11.22%(-6.53)#8,687 |
| 53. | Fallston | 4.67% | 1.74%(+2.93)#53 | 11.22%(-6.55)#8,704 |
| 54. | Charlotte Hall | 4.61% | 1.74%(+2.87)#54 | 11.22%(-6.61)#8,776 |
| 55. | Mount Lena | 4.37% | 1.74%(+2.63)#55 | 11.22%(-6.85)#9,035 |
| 56. | Glenn Dale | 4.32% | 1.74%(+2.58)#56 | 11.22%(-6.90)#9,094 |
| 57. | Indian Head | 4.22% | 1.74%(+2.48)#57 | 11.22%(-7.00)#9,212 |
| 58. | Wilson Conococheague | 4.19% | 1.74%(+2.45)#58 | 11.22%(-7.03)#9,245 |
| 59. | Croom | 4.08% | 1.74%(+2.34)#59 | 11.22%(-7.14)#9,366 |
| 60. | Riviera Beach | 4.04% | 1.74%(+2.30)#60 | 11.22%(-7.18)#9,413 |
| 61. | Bel Air | 4.04% | 1.74%(+2.30)#61 | 11.22%(-7.18)#9,423 |
| 62. | South Laurel | 4.01% | 1.74%(+2.27)#62 | 11.22%(-7.21)#9,442 |
| 63. | Cheverly | 3.91% | 1.74%(+2.17)#63 | 11.22%(-7.31)#9,553 |
| 64. | Point Of Rocks | 3.90% | 1.74%(+2.16)#64 | 11.22%(-7.32)#9,575 |
| 65. | Willards | 3.88% | 1.74%(+2.14)#65 | 11.22%(-7.34)#9,593 |
| 66. | St Michaels | 3.87% | 1.74%(+2.13)#66 | 11.22%(-7.35)#9,594 |
| 67. | Flower Hill | 3.85% | 1.74%(+2.11)#67 | 11.22%(-7.36)#9,618 |
| 68. | Dunkirk | 3.78% | 1.74%(+2.04)#68 | 11.22%(-7.44)#9,713 |
| 69. | Friendly | 3.68% | 1.74%(+1.94)#69 | 11.22%(-7.53)#9,838 |
| 70. | Charlestown | 3.66% | 1.74%(+1.92)#70 | 11.22%(-7.56)#9,880 |
| 71. | Accident | 3.58% | 1.74%(+1.84)#71 | 11.22%(-7.64)#10,006 |
| 72. | Berwyn Heights | 3.56% | 1.74%(+1.82)#72 | 11.22%(-7.66)#10,028 |
| 73. | Ballenger Creek | 3.45% | 1.74%(+1.70)#73 | 11.22%(-7.77)#10,208 |
| 74. | Elkton | 3.42% | 1.74%(+1.68)#74 | 11.22%(-7.80)#10,231 |
| 75. | Aberdeen | 3.36% | 1.74%(+1.61)#75 | 11.22%(-7.86)#10,331 |
| 76. | Princess Anne | 3.26% | 1.74%(+1.52)#76 | 11.22%(-7.96)#10,478 |
| 77. | Adelphi | 3.20% | 1.74%(+1.46)#77 | 11.22%(-8.01)#10,556 |
| 78. | Montgomery Village | 3.16% | 1.74%(+1.42)#78 | 11.22%(-8.06)#10,644 |
| 79. | Piney Point | 3.10% | 1.74%(+1.36)#79 | 11.22%(-8.12)#10,735 |
| 80. | Berlin | 3.07% | 1.74%(+1.33)#80 | 11.22%(-8.15)#10,799 |
| 81. | Crumpton | 3.06% | 1.74%(+1.32)#81 | 11.22%(-8.16)#10,810 |
| 82. | Arnold | 3.05% | 1.74%(+1.31)#82 | 11.22%(-8.17)#10,830 |
| 83. | Romancoke | 3.01% | 1.74%(+1.27)#83 | 11.22%(-8.21)#10,890 |
| 84. | Marlboro Meadows | 3.01% | 1.74%(+1.27)#84 | 11.22%(-8.21)#10,896 |
| 85. | Westphalia | 2.97% | 1.74%(+1.23)#85 | 11.22%(-8.25)#10,972 |
| 86. | Easton | 2.96% | 1.74%(+1.22)#86 | 11.22%(-8.26)#10,984 |
| 87. | North Beach | 2.95% | 1.74%(+1.21)#87 | 11.22%(-8.27)#11,014 |
| 88. | California | 2.93% | 1.74%(+1.19)#88 | 11.22%(-8.29)#11,054 |
| 89. | Laurel | 2.90% | 1.74%(+1.16)#89 | 11.22%(-8.32)#11,096 |
| 90. | Chillum | 2.89% | 1.74%(+1.15)#90 | 11.22%(-8.33)#11,112 |
| 91. | White Oak | 2.89% | 1.74%(+1.15)#91 | 11.22%(-8.33)#11,131 |
| 92. | Beltsville | 2.88% | 1.74%(+1.14)#92 | 11.22%(-8.34)#11,146 |
| 93. | University Park | 2.87% | 1.74%(+1.13)#93 | 11.22%(-8.35)#11,154 |
| 94. | Hyattsville | 2.82% | 1.74%(+1.08)#94 | 11.22%(-8.40)#11,239 |
| 95. | New Carrollton | 2.81% | 1.74%(+1.07)#95 | 11.22%(-8.41)#11,252 |
| 96. | Crisfield | 2.74% | 1.74%(+1.00)#96 | 11.22%(-8.48)#11,376 |
| 97. | Queenstown | 2.70% | 1.74%(+0.959)#97 | 11.22%(-8.52)#11,463 |
| 98. | Salisbury | 2.69% | 1.74%(+0.948)#98 | 11.22%(-8.53)#11,490 |
| 99. | Friendsville | 2.68% | 1.74%(+0.936)#99 | 11.22%(-8.54)#11,513 |
| 100. | Pasadena | 2.64% | 1.74%(+0.903)#100 | 11.22%(-8.58)#11,590 |
Common Questions
What are the Top 10 Cities with the Highest Percentage of Mexican Population in Maryland?
Top 10 Cities with the Highest Percentage of Mexican Population in Maryland are:
#1
29.67%
#2
21.58%
#3
20.37%
#4
18.38%
#5
17.77%
#6
16.90%
#7
16.78%
#8
15.07%
#9
14.12%
#10
14.03%
What city has the Highest Percentage of Mexican Population in Maryland?
Templeville has the Highest Percentage of Mexican Population in Maryland with 29.67%.
What is the Percentage of Mexican Population in the State of Maryland?
Percentage of Mexican Population in Maryland is 1.74%.
What is the Percentage of Mexican Population in the United States?
Percentage of Mexican Population in the United States is 11.22%.