Cities with the Highest Percentage of Mexican Population in North Carolina
RELATED REPORTS & OPTIONS
Mexican
North Carolina
Compare Cities
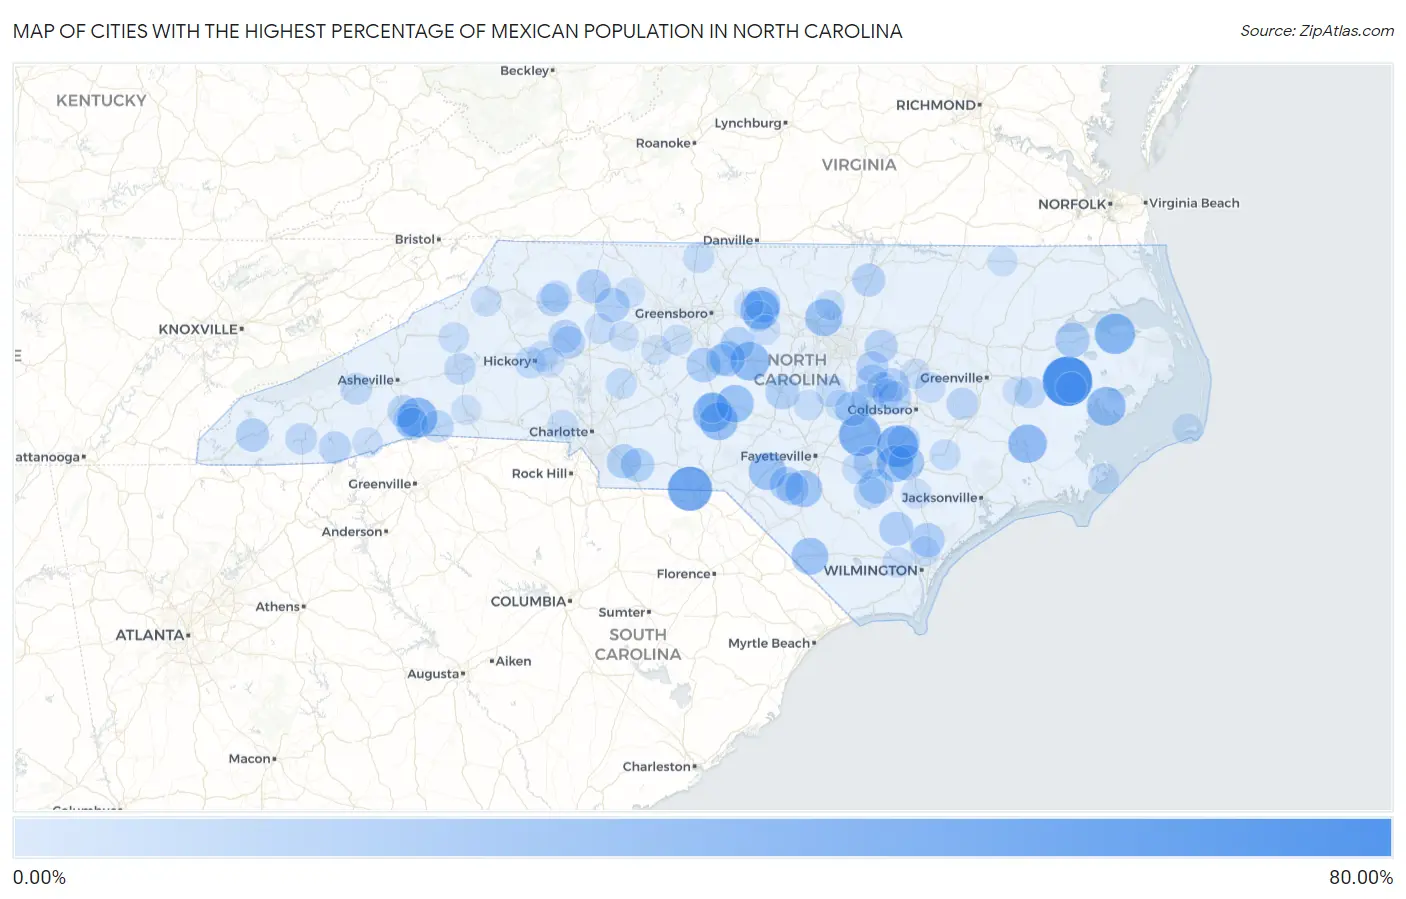
Map of Cities with the Highest Percentage of Mexican Population in North Carolina
0.00%
80.00%
Cities with the Highest Percentage of Mexican Population in North Carolina
| City | Mexican | vs State | vs National | |
| 1. | Pantego | 61.22% | 5.26%(+56.0)#1 | 11.22%(+50.0)#867 |
| 2. | Bowdens | 59.78% | 5.26%(+54.5)#2 | 11.22%(+48.6)#900 |
| 3. | Emma | 47.09% | 5.26%(+41.8)#3 | 11.22%(+35.9)#1,243 |
| 4. | Mcfarlan | 46.85% | 5.26%(+41.6)#4 | 11.22%(+35.6)#1,251 |
| 5. | Spivey S Corner | 41.24% | 5.26%(+36.0)#5 | 11.22%(+30.0)#1,480 |
| 6. | Faison | 39.68% | 5.26%(+34.4)#6 | 11.22%(+28.5)#1,539 |
| 7. | Columbia | 37.14% | 5.26%(+31.9)#7 | 11.22%(+25.9)#1,655 |
| 8. | Dana | 34.91% | 5.26%(+29.7)#8 | 11.22%(+23.7)#1,783 |
| 9. | Biscoe | 33.41% | 5.26%(+28.2)#9 | 11.22%(+22.2)#1,886 |
| 10. | Haw River | 32.90% | 5.26%(+27.6)#10 | 11.22%(+21.7)#1,928 |
| 11. | Swan Quarter | 32.76% | 5.26%(+27.5)#11 | 11.22%(+21.5)#1,941 |
| 12. | Siler City | 32.41% | 5.26%(+27.1)#12 | 11.22%(+21.2)#1,966 |
| 13. | Bridgeton | 32.14% | 5.26%(+26.9)#13 | 11.22%(+20.9)#1,981 |
| 14. | Candor | 30.57% | 5.26%(+25.3)#14 | 11.22%(+19.3)#2,081 |
| 15. | Bowmore | 29.23% | 5.26%(+24.0)#15 | 11.22%(+18.0)#2,178 |
| 16. | Robbins | 29.19% | 5.26%(+23.9)#16 | 11.22%(+18.0)#2,179 |
| 17. | Gorman | 28.72% | 5.26%(+23.5)#17 | 11.22%(+17.5)#2,212 |
| 18. | St Pauls | 27.86% | 5.26%(+22.6)#18 | 11.22%(+16.6)#2,287 |
| 19. | Cerro Gordo | 27.56% | 5.26%(+22.3)#19 | 11.22%(+16.3)#2,314 |
| 20. | Turkey | 26.67% | 5.26%(+21.4)#20 | 11.22%(+15.4)#2,399 |
| 21. | Green Level | 24.72% | 5.26%(+19.5)#21 | 11.22%(+13.5)#2,576 |
| 22. | Warsaw | 24.68% | 5.26%(+19.4)#22 | 11.22%(+13.5)#2,578 |
| 23. | Ramseur | 23.39% | 5.26%(+18.1)#23 | 11.22%(+12.2)#2,696 |
| 24. | Roper | 22.11% | 5.26%(+16.9)#24 | 11.22%(+10.9)#2,814 |
| 25. | Asheboro | 21.95% | 5.26%(+16.7)#25 | 11.22%(+10.7)#2,830 |
| 26. | Ingold | 21.93% | 5.26%(+16.7)#26 | 11.22%(+10.7)#2,836 |
| 27. | Benson | 21.60% | 5.26%(+16.3)#27 | 11.22%(+10.4)#2,882 |
| 28. | Rocky Point | 21.06% | 5.26%(+15.8)#28 | 11.22%(+9.84)#2,937 |
| 29. | Yadkinville | 21.04% | 5.26%(+15.8)#29 | 11.22%(+9.82)#2,939 |
| 30. | Atkinson | 20.73% | 5.26%(+15.5)#30 | 11.22%(+9.51)#2,967 |
| 31. | Shannon | 20.41% | 5.26%(+15.1)#31 | 11.22%(+9.19)#3,016 |
| 32. | Elkin | 20.29% | 5.26%(+15.0)#32 | 11.22%(+9.07)#3,037 |
| 33. | Monroe | 20.28% | 5.26%(+15.0)#33 | 11.22%(+9.06)#3,046 |
| 34. | Sanford | 20.18% | 5.26%(+14.9)#34 | 11.22%(+8.96)#3,057 |
| 35. | Liberty | 19.92% | 5.26%(+14.7)#35 | 11.22%(+8.70)#3,088 |
| 36. | Wingate | 19.60% | 5.26%(+14.3)#36 | 11.22%(+8.38)#3,131 |
| 37. | Micro | 19.08% | 5.26%(+13.8)#37 | 11.22%(+7.86)#3,201 |
| 38. | Andrews | 18.74% | 5.26%(+13.5)#38 | 11.22%(+7.52)#3,246 |
| 39. | Barker Heights | 18.51% | 5.26%(+13.2)#39 | 11.22%(+7.29)#3,271 |
| 40. | Calypso | 18.41% | 5.26%(+13.2)#40 | 11.22%(+7.20)#3,283 |
| 41. | South Henderson | 18.37% | 5.26%(+13.1)#41 | 11.22%(+7.15)#3,295 |
| 42. | Wilson S Mills | 18.33% | 5.26%(+13.1)#42 | 11.22%(+7.11)#3,300 |
| 43. | Hiddenite | 17.87% | 5.26%(+12.6)#43 | 11.22%(+6.65)#3,368 |
| 44. | Four Oaks | 17.85% | 5.26%(+12.6)#44 | 11.22%(+6.63)#3,372 |
| 45. | Zebulon | 17.76% | 5.26%(+12.5)#45 | 11.22%(+6.54)#3,385 |
| 46. | Bonnetsville | 17.73% | 5.26%(+12.5)#46 | 11.22%(+6.51)#3,391 |
| 47. | Princeton | 17.61% | 5.26%(+12.3)#47 | 11.22%(+6.39)#3,414 |
| 48. | Rennert | 17.33% | 5.26%(+12.1)#48 | 11.22%(+6.11)#3,453 |
| 49. | Stony Point | 17.27% | 5.26%(+12.0)#49 | 11.22%(+6.05)#3,465 |
| 50. | Archer Lodge | 17.10% | 5.26%(+11.8)#50 | 11.22%(+5.88)#3,504 |
| 51. | Mountain Home | 16.68% | 5.26%(+11.4)#51 | 11.22%(+5.46)#3,581 |
| 52. | Cashiers | 16.36% | 5.26%(+11.1)#52 | 11.22%(+5.14)#3,640 |
| 53. | East Flat Rock | 16.33% | 5.26%(+11.1)#53 | 11.22%(+5.11)#3,647 |
| 54. | Garland | 16.27% | 5.26%(+11.0)#54 | 11.22%(+5.05)#3,657 |
| 55. | Cricket | 16.10% | 5.26%(+10.8)#55 | 11.22%(+4.88)#3,684 |
| 56. | Columbus | 15.92% | 5.26%(+10.7)#56 | 11.22%(+4.70)#3,713 |
| 57. | Hookerton | 15.57% | 5.26%(+10.3)#57 | 11.22%(+4.35)#3,772 |
| 58. | Clyde | 14.75% | 5.26%(+9.49)#58 | 11.22%(+3.53)#3,938 |
| 59. | Franklin | 14.75% | 5.26%(+9.49)#59 | 11.22%(+3.53)#3,939 |
| 60. | River Road | 14.71% | 5.26%(+9.45)#60 | 11.22%(+3.49)#3,946 |
| 61. | Marion | 14.48% | 5.26%(+9.22)#61 | 11.22%(+3.26)#4,007 |
| 62. | Franklinville | 14.22% | 5.26%(+8.96)#62 | 11.22%(+3.00)#4,066 |
| 63. | Long View | 13.94% | 5.26%(+8.68)#63 | 11.22%(+2.72)#4,132 |
| 64. | Fairplains | 13.63% | 5.26%(+8.38)#64 | 11.22%(+2.41)#4,197 |
| 65. | Roseboro | 13.44% | 5.26%(+8.19)#65 | 11.22%(+2.23)#4,240 |
| 66. | Pink Hill | 13.26% | 5.26%(+8.00)#66 | 11.22%(+2.04)#4,287 |
| 67. | Angier | 13.00% | 5.26%(+7.74)#67 | 11.22%(+1.78)#4,340 |
| 68. | China Grove | 12.95% | 5.26%(+7.69)#68 | 11.22%(+1.73)#4,350 |
| 69. | Stoneville | 12.93% | 5.26%(+7.67)#69 | 11.22%(+1.71)#4,356 |
| 70. | Atlantic | 12.92% | 5.26%(+7.66)#70 | 11.22%(+1.70)#4,358 |
| 71. | Star | 12.83% | 5.26%(+7.57)#71 | 11.22%(+1.61)#4,383 |
| 72. | St Stephens | 12.55% | 5.26%(+7.29)#72 | 11.22%(+1.33)#4,451 |
| 73. | Spruce Pine | 12.36% | 5.26%(+7.10)#73 | 11.22%(+1.14)#4,496 |
| 74. | Selma | 12.27% | 5.26%(+7.01)#74 | 11.22%(+1.05)#4,530 |
| 75. | Belhaven | 12.19% | 5.26%(+6.93)#75 | 11.22%(+0.973)#4,550 |
| 76. | Sandy Creek | 12.17% | 5.26%(+6.91)#76 | 11.22%(+0.952)#4,553 |
| 77. | Harmony | 12.16% | 5.26%(+6.90)#77 | 11.22%(+0.938)#4,556 |
| 78. | Thomasville | 12.00% | 5.26%(+6.74)#78 | 11.22%(+0.779)#4,605 |
| 79. | Graham | 11.99% | 5.26%(+6.73)#79 | 11.22%(+0.767)#4,610 |
| 80. | Eureka | 11.98% | 5.26%(+6.72)#80 | 11.22%(+0.763)#4,613 |
| 81. | Mamers | 11.98% | 5.26%(+6.72)#81 | 11.22%(+0.757)#4,616 |
| 82. | Foscoe | 11.91% | 5.26%(+6.65)#82 | 11.22%(+0.687)#4,631 |
| 83. | Pine Level | 11.81% | 5.26%(+6.56)#83 | 11.22%(+0.596)#4,647 |
| 84. | Lowell | 11.62% | 5.26%(+6.36)#84 | 11.22%(+0.401)#4,703 |
| 85. | Rosman | 11.37% | 5.26%(+6.11)#85 | 11.22%(+0.152)#4,786 |
| 86. | Saxapahaw | 11.33% | 5.26%(+6.07)#86 | 11.22%(+0.114)#4,793 |
| 87. | Teachey | 11.32% | 5.26%(+6.07)#87 | 11.22%(+0.105)#4,797 |
| 88. | Frisco | 11.23% | 5.26%(+5.97)#88 | 11.22%(+0.010)#4,834 |
| 89. | Lucama | 11.15% | 5.26%(+5.89)#89 | 11.22%(-0.066)#4,854 |
| 90. | Castle Hayne | 11.13% | 5.26%(+5.88)#90 | 11.22%(-0.085)#4,858 |
| 91. | Mocksville | 11.09% | 5.26%(+5.83)#91 | 11.22%(-0.132)#4,875 |
| 92. | Conover | 11.00% | 5.26%(+5.74)#92 | 11.22%(-0.222)#4,897 |
| 93. | Lexington | 10.96% | 5.26%(+5.70)#93 | 11.22%(-0.257)#4,908 |
| 94. | East Bend | 10.93% | 5.26%(+5.67)#94 | 11.22%(-0.288)#4,917 |
| 95. | Coats | 10.93% | 5.26%(+5.67)#95 | 11.22%(-0.290)#4,919 |
| 96. | Conway | 10.86% | 5.26%(+5.60)#96 | 11.22%(-0.359)#4,944 |
| 97. | Ruth | 10.79% | 5.26%(+5.53)#97 | 11.22%(-0.430)#4,967 |
| 98. | Glen Raven | 10.67% | 5.26%(+5.42)#98 | 11.22%(-0.545)#5,003 |
| 99. | Butner | 10.60% | 5.26%(+5.35)#99 | 11.22%(-0.615)#5,024 |
| 100. | Chocowinity | 10.58% | 5.26%(+5.32)#100 | 11.22%(-0.643)#5,036 |
Common Questions
What are the Top 10 Cities with the Highest Percentage of Mexican Population in North Carolina?
Top 10 Cities with the Highest Percentage of Mexican Population in North Carolina are:
#1
61.22%
#2
46.85%
#3
41.24%
#4
39.68%
#5
37.14%
#6
34.91%
#7
33.41%
#8
32.90%
#9
32.76%
#10
32.41%
What city has the Highest Percentage of Mexican Population in North Carolina?
Pantego has the Highest Percentage of Mexican Population in North Carolina with 61.22%.
What is the Percentage of Mexican Population in the State of North Carolina?
Percentage of Mexican Population in North Carolina is 5.26%.
What is the Percentage of Mexican Population in the United States?
Percentage of Mexican Population in the United States is 11.22%.