Cities with the Highest Percentage of Mexican Population in Missouri
RELATED REPORTS & OPTIONS
Mexican
Missouri
Compare Cities
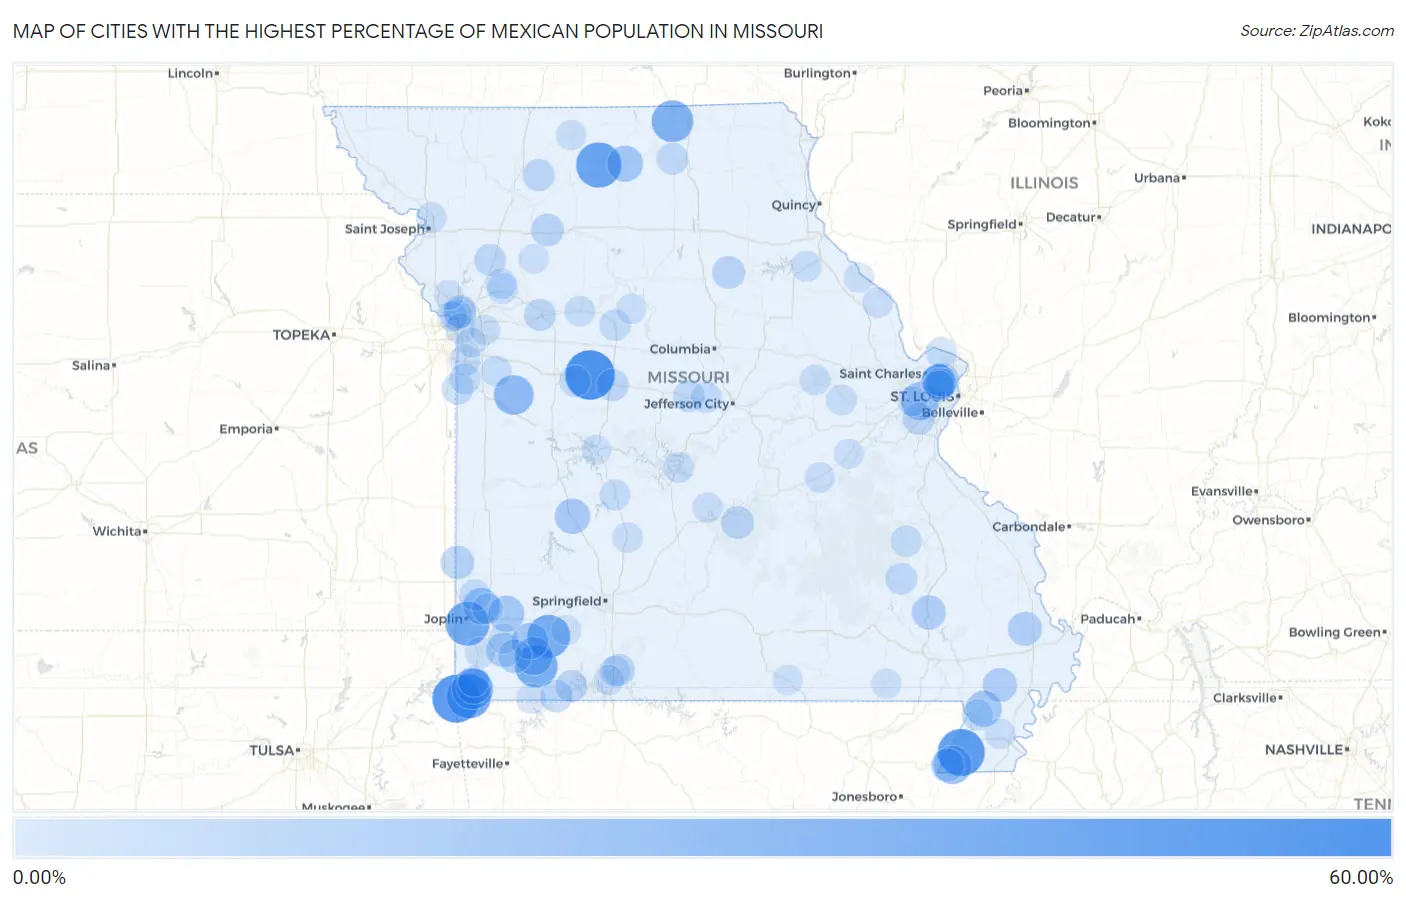
Map of Cities with the Highest Percentage of Mexican Population in Missouri
0.00%
60.00%
Cities with the Highest Percentage of Mexican Population in Missouri
| City | Mexican | vs State | vs National | |
| 1. | La Monte | 52.09% | 2.91%(+49.2)#1 | 11.22%(+40.9)#1,079 |
| 2. | Southwest City | 48.18% | 2.91%(+45.3)#2 | 11.22%(+37.0)#1,205 |
| 3. | Senath | 46.09% | 2.91%(+43.2)#3 | 11.22%(+34.9)#1,292 |
| 4. | Osgood | 41.67% | 2.91%(+38.8)#4 | 11.22%(+30.4)#1,464 |
| 5. | Noel | 40.10% | 2.91%(+37.2)#5 | 11.22%(+28.9)#1,521 |
| 6. | Dennis Acres | 38.46% | 2.91%(+35.6)#6 | 11.22%(+27.2)#1,592 |
| 7. | Verona | 36.19% | 2.91%(+33.3)#7 | 11.22%(+25.0)#1,704 |
| 8. | Butterfield | 35.42% | 2.91%(+32.5)#8 | 11.22%(+24.2)#1,756 |
| 9. | Livonia | 33.33% | 2.91%(+30.4)#9 | 11.22%(+22.1)#1,897 |
| 10. | Ginger Blue | 31.86% | 2.91%(+29.0)#10 | 11.22%(+20.6)#1,994 |
| 11. | La Tour | 28.22% | 2.91%(+25.3)#11 | 11.22%(+17.0)#2,254 |
| 12. | Arbyrd | 25.47% | 2.91%(+22.6)#12 | 11.22%(+14.2)#2,512 |
| 13. | Winchester | 24.63% | 2.91%(+21.7)#13 | 11.22%(+13.4)#2,583 |
| 14. | Purdy | 24.24% | 2.91%(+21.3)#14 | 11.22%(+13.0)#2,620 |
| 15. | Brooklyn Heights | 21.24% | 2.91%(+18.3)#15 | 11.22%(+10.0)#2,927 |
| 16. | Monett | 20.60% | 2.91%(+17.7)#16 | 11.22%(+9.38)#2,989 |
| 17. | Reeds | 20.27% | 2.91%(+17.4)#17 | 11.22%(+9.05)#3,048 |
| 18. | Milan | 20.21% | 2.91%(+17.3)#18 | 11.22%(+8.99)#3,054 |
| 19. | Clarkton | 19.65% | 2.91%(+16.7)#19 | 11.22%(+8.43)#3,123 |
| 20. | Lanagan | 18.24% | 2.91%(+15.3)#20 | 11.22%(+7.03)#3,313 |
| 21. | Humansville | 18.15% | 2.91%(+15.2)#21 | 11.22%(+6.93)#3,328 |
| 22. | Breckenridge Hills | 17.92% | 2.91%(+15.0)#22 | 11.22%(+6.71)#3,359 |
| 23. | Woodson Terrace | 17.20% | 2.91%(+14.3)#23 | 11.22%(+5.98)#3,483 |
| 24. | Stark City | 16.67% | 2.91%(+13.8)#24 | 11.22%(+5.45)#3,585 |
| 25. | Greenville | 15.54% | 2.91%(+12.6)#25 | 11.22%(+4.32)#3,784 |
| 26. | Parma | 15.41% | 2.91%(+12.5)#26 | 11.22%(+4.19)#3,807 |
| 27. | Haywood City | 15.12% | 2.91%(+12.2)#27 | 11.22%(+3.90)#3,862 |
| 28. | Kinloch | 14.43% | 2.91%(+11.5)#28 | 11.22%(+3.21)#4,016 |
| 29. | Fairview | 14.07% | 2.91%(+11.2)#29 | 11.22%(+2.85)#4,099 |
| 30. | Mindenmines | 13.70% | 2.91%(+10.8)#30 | 11.22%(+2.48)#4,185 |
| 31. | Cardwell | 12.99% | 2.91%(+10.1)#31 | 11.22%(+1.77)#4,343 |
| 32. | Madison | 12.34% | 2.91%(+9.43)#32 | 11.22%(+1.12)#4,509 |
| 33. | Fort Leonard Wood | 12.23% | 2.91%(+9.32)#33 | 11.22%(+1.01)#4,543 |
| 34. | Breckenridge | 12.06% | 2.91%(+9.15)#34 | 11.22%(+0.843)#4,589 |
| 35. | Blue Summit | 11.64% | 2.91%(+8.73)#35 | 11.22%(+0.418)#4,693 |
| 36. | Oakwood Park | 11.55% | 2.91%(+8.65)#36 | 11.22%(+0.335)#4,725 |
| 37. | Chain O Lakes | 11.26% | 2.91%(+8.35)#37 | 11.22%(+0.042)#4,818 |
| 38. | Sedalia | 11.15% | 2.91%(+8.24)#38 | 11.22%(-0.074)#4,855 |
| 39. | Peaceful Village | 11.02% | 2.91%(+8.12)#39 | 11.22%(-0.195)#4,892 |
| 40. | Edmundson | 10.95% | 2.91%(+8.04)#40 | 11.22%(-0.271)#4,912 |
| 41. | Gilman City | 10.92% | 2.91%(+8.01)#41 | 11.22%(-0.297)#4,921 |
| 42. | Merriam Woods | 10.87% | 2.91%(+7.96)#42 | 11.22%(-0.350)#4,942 |
| 43. | Lathrop | 10.57% | 2.91%(+7.66)#43 | 11.22%(-0.653)#5,041 |
| 44. | Shell Knob | 10.53% | 2.91%(+7.62)#44 | 11.22%(-0.689)#5,060 |
| 45. | Lexington | 10.52% | 2.91%(+7.61)#45 | 11.22%(-0.701)#5,068 |
| 46. | California | 10.22% | 2.91%(+7.31)#46 | 11.22%(-0.998)#5,165 |
| 47. | Annapolis | 10.19% | 2.91%(+7.28)#47 | 11.22%(-1.03)#5,174 |
| 48. | Novinger | 10.18% | 2.91%(+7.27)#48 | 11.22%(-1.04)#5,180 |
| 49. | Cleveland | 10.08% | 2.91%(+7.17)#49 | 11.22%(-1.14)#5,217 |
| 50. | St John | 9.80% | 2.91%(+6.89)#50 | 11.22%(-1.42)#5,330 |
| 51. | Marshall | 9.47% | 2.91%(+6.56)#51 | 11.22%(-1.75)#5,466 |
| 52. | Whiteman Afb | 9.47% | 2.91%(+6.56)#52 | 11.22%(-1.75)#5,467 |
| 53. | Overland | 9.45% | 2.91%(+6.54)#53 | 11.22%(-1.77)#5,476 |
| 54. | Oaks | 9.29% | 2.91%(+6.38)#54 | 11.22%(-1.93)#5,545 |
| 55. | Grandview | 9.14% | 2.91%(+6.23)#55 | 11.22%(-2.08)#5,602 |
| 56. | Riverview Estates | 8.99% | 2.91%(+6.08)#56 | 11.22%(-2.23)#5,673 |
| 57. | Purcell | 8.94% | 2.91%(+6.03)#57 | 11.22%(-2.28)#5,693 |
| 58. | Holcomb | 8.77% | 2.91%(+5.86)#58 | 11.22%(-2.45)#5,755 |
| 59. | Northmoor | 8.71% | 2.91%(+5.80)#59 | 11.22%(-2.51)#5,794 |
| 60. | Baldwin Park | 8.70% | 2.91%(+5.79)#60 | 11.22%(-2.52)#5,801 |
| 61. | Pilot Knob | 8.54% | 2.91%(+5.63)#61 | 11.22%(-2.68)#5,875 |
| 62. | Centertown | 8.46% | 2.91%(+5.55)#62 | 11.22%(-2.76)#5,912 |
| 63. | Bull Creek | 8.29% | 2.91%(+5.38)#63 | 11.22%(-2.93)#6,011 |
| 64. | Homestead | 8.28% | 2.91%(+5.37)#64 | 11.22%(-2.94)#6,022 |
| 65. | Portage Des Sioux | 8.18% | 2.91%(+5.27)#65 | 11.22%(-3.04)#6,077 |
| 66. | Preston | 8.14% | 2.91%(+5.23)#66 | 11.22%(-3.08)#6,099 |
| 67. | Excelsior Estates | 7.99% | 2.91%(+5.08)#67 | 11.22%(-3.23)#6,190 |
| 68. | Center | 7.93% | 2.91%(+5.03)#68 | 11.22%(-3.29)#6,218 |
| 69. | New Haven | 7.91% | 2.91%(+5.00)#69 | 11.22%(-3.31)#6,226 |
| 70. | Carthage | 7.81% | 2.91%(+4.90)#70 | 11.22%(-3.41)#6,277 |
| 71. | Burfordville | 7.75% | 2.91%(+4.84)#71 | 11.22%(-3.47)#6,308 |
| 72. | Country Club | 7.74% | 2.91%(+4.83)#72 | 11.22%(-3.48)#6,321 |
| 73. | Kansas City | 7.63% | 2.91%(+4.72)#73 | 11.22%(-3.59)#6,374 |
| 74. | Mckittrick | 7.61% | 2.91%(+4.70)#74 | 11.22%(-3.61)#6,387 |
| 75. | Osage Beach | 7.60% | 2.91%(+4.69)#75 | 11.22%(-3.62)#6,391 |
| 76. | Anderson | 7.50% | 2.91%(+4.59)#76 | 11.22%(-3.72)#6,448 |
| 77. | Waverly | 7.47% | 2.91%(+4.57)#77 | 11.22%(-3.74)#6,462 |
| 78. | Paynesville | 7.32% | 2.91%(+4.41)#78 | 11.22%(-3.90)#6,544 |
| 79. | Pascola | 7.23% | 2.91%(+4.32)#79 | 11.22%(-3.99)#6,600 |
| 80. | Neosho | 7.10% | 2.91%(+4.20)#80 | 11.22%(-4.12)#6,668 |
| 81. | Riverside | 7.09% | 2.91%(+4.19)#81 | 11.22%(-4.12)#6,676 |
| 82. | Seligman | 7.06% | 2.91%(+4.16)#82 | 11.22%(-4.16)#6,692 |
| 83. | Buffalo | 6.90% | 2.91%(+3.99)#83 | 11.22%(-4.32)#6,787 |
| 84. | Ritchey | 6.82% | 2.91%(+3.91)#84 | 11.22%(-4.40)#6,837 |
| 85. | Branson | 6.76% | 2.91%(+3.85)#85 | 11.22%(-4.46)#6,879 |
| 86. | Independence | 6.72% | 2.91%(+3.81)#86 | 11.22%(-4.50)#6,908 |
| 87. | Richland | 6.68% | 2.91%(+3.77)#87 | 11.22%(-4.54)#6,935 |
| 88. | Princeton | 6.65% | 2.91%(+3.74)#88 | 11.22%(-4.57)#6,954 |
| 89. | Cuba | 6.62% | 2.91%(+3.71)#89 | 11.22%(-4.60)#6,976 |
| 90. | Brandsville | 6.56% | 2.91%(+3.65)#90 | 11.22%(-4.66)#7,022 |
| 91. | Slater | 6.49% | 2.91%(+3.58)#91 | 11.22%(-4.73)#7,068 |
| 92. | Cowgill | 6.47% | 2.91%(+3.56)#92 | 11.22%(-4.75)#7,085 |
| 93. | Louisiana | 6.46% | 2.91%(+3.56)#93 | 11.22%(-4.76)#7,087 |
| 94. | Marionville | 6.43% | 2.91%(+3.52)#94 | 11.22%(-4.79)#7,113 |
| 95. | Warsaw | 6.32% | 2.91%(+3.41)#95 | 11.22%(-4.90)#7,207 |
| 96. | Doniphan | 6.31% | 2.91%(+3.41)#96 | 11.22%(-4.90)#7,210 |
| 97. | Ferrelview | 6.30% | 2.91%(+3.39)#97 | 11.22%(-4.92)#7,225 |
| 98. | Oak Grove Village | 6.23% | 2.91%(+3.32)#98 | 11.22%(-4.99)#7,276 |
| 99. | Raytown | 6.22% | 2.91%(+3.32)#99 | 11.22%(-5.00)#7,283 |
| 100. | Ellisville | 6.22% | 2.91%(+3.32)#100 | 11.22%(-5.00)#7,284 |
Common Questions
What are the Top 10 Cities with the Highest Percentage of Mexican Population in Missouri?
Top 10 Cities with the Highest Percentage of Mexican Population in Missouri are:
#1
52.09%
#2
48.18%
#3
46.09%
#4
41.67%
#5
40.10%
#6
38.46%
#7
36.19%
#8
35.42%
#9
33.33%
#10
31.86%
What city has the Highest Percentage of Mexican Population in Missouri?
La Monte has the Highest Percentage of Mexican Population in Missouri with 52.09%.
What is the Percentage of Mexican Population in the State of Missouri?
Percentage of Mexican Population in Missouri is 2.91%.
What is the Percentage of Mexican Population in the United States?
Percentage of Mexican Population in the United States is 11.22%.