Cities with the Highest Percentage of Mexican Population in Indiana
RELATED REPORTS & OPTIONS
Mexican
Indiana
Compare Cities
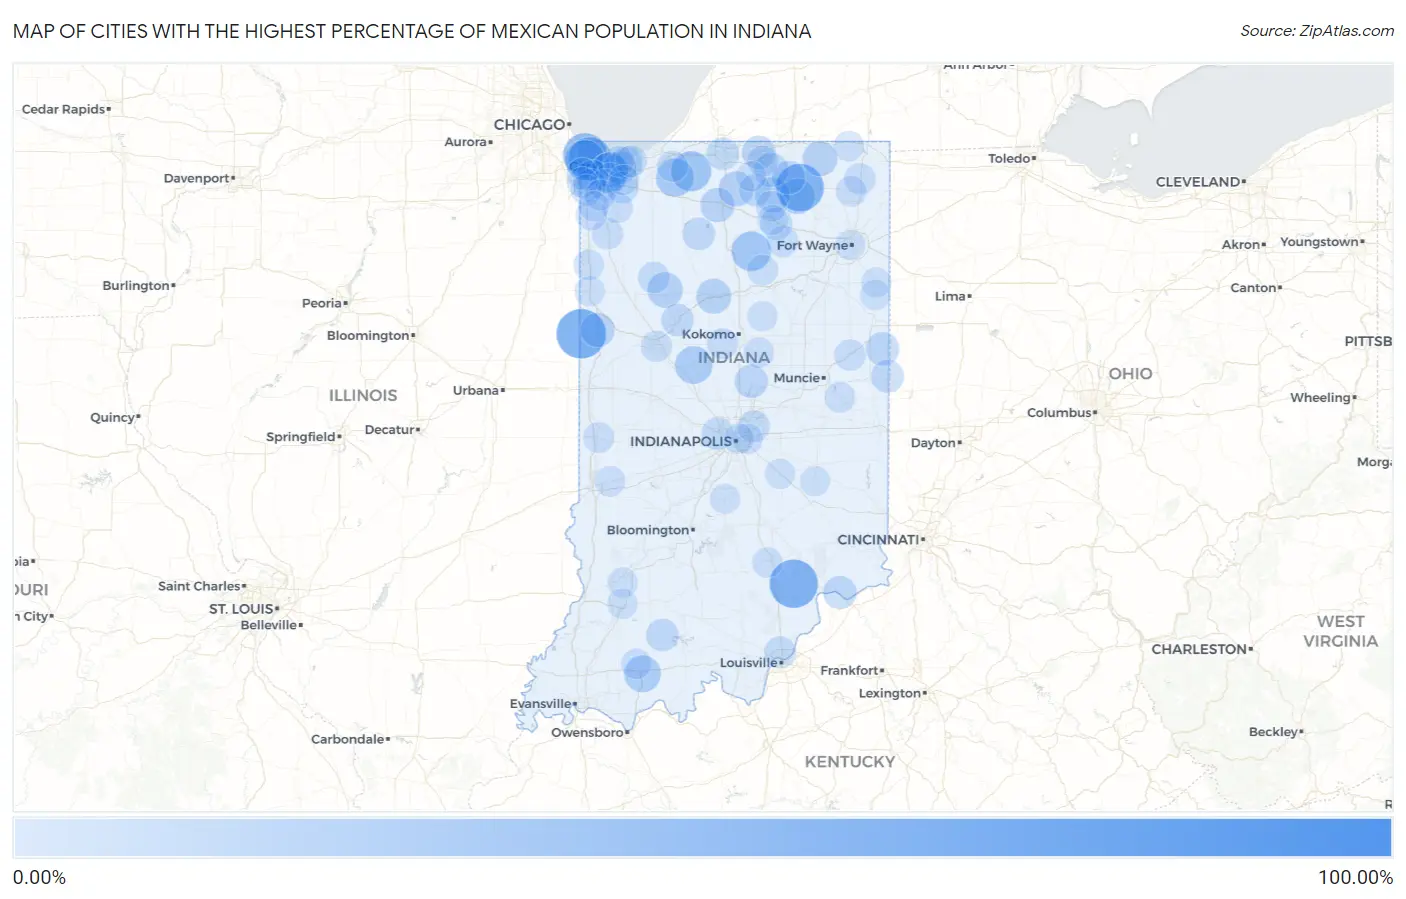
Map of Cities with the Highest Percentage of Mexican Population in Indiana
0.00%
100.00%
Cities with the Highest Percentage of Mexican Population in Indiana
| City | Mexican | vs State | vs National | |
| 1. | Linn Grove | 94.02% | 5.28%(+88.7)#1 | 11.22%(+82.8)#254 |
| 2. | Pence | 78.53% | 5.28%(+73.2)#2 | 11.22%(+67.3)#537 |
| 3. | Hillisburg | 77.38% | 5.28%(+72.1)#3 | 11.22%(+66.2)#554 |
| 4. | Fair Oaks | 72.56% | 5.28%(+67.3)#4 | 11.22%(+61.3)#652 |
| 5. | Ambia | 61.30% | 5.28%(+56.0)#5 | 11.22%(+50.1)#864 |
| 6. | Deputy | 57.89% | 5.28%(+52.6)#6 | 11.22%(+46.7)#942 |
| 7. | Ligonier | 55.99% | 5.28%(+50.7)#7 | 11.22%(+44.8)#988 |
| 8. | Brimfield | 48.32% | 5.28%(+43.0)#8 | 11.22%(+37.1)#1,199 |
| 9. | Whiting | 44.91% | 5.28%(+39.6)#9 | 11.22%(+33.7)#1,339 |
| 10. | East Chicago | 43.81% | 5.28%(+38.5)#10 | 11.22%(+32.6)#1,378 |
| 11. | Fish Lake | 34.65% | 5.28%(+29.4)#11 | 11.22%(+23.4)#1,803 |
| 12. | Hammond | 34.20% | 5.28%(+28.9)#12 | 11.22%(+23.0)#1,831 |
| 13. | Akron | 33.24% | 5.28%(+28.0)#13 | 11.22%(+22.0)#1,905 |
| 14. | New Chicago | 31.83% | 5.28%(+26.6)#14 | 11.22%(+20.6)#1,996 |
| 15. | Kingsbury | 29.07% | 5.28%(+23.8)#15 | 11.22%(+17.9)#2,186 |
| 16. | Frankfort | 27.49% | 5.28%(+22.2)#16 | 11.22%(+16.3)#2,325 |
| 17. | Dale | 25.58% | 5.28%(+20.3)#17 | 11.22%(+14.4)#2,493 |
| 18. | Lake Station | 23.07% | 5.28%(+17.8)#18 | 11.22%(+11.8)#2,728 |
| 19. | Cromwell | 21.92% | 5.28%(+16.6)#19 | 11.22%(+10.7)#2,839 |
| 20. | Norway | 21.43% | 5.28%(+16.1)#20 | 11.22%(+10.2)#2,900 |
| 21. | Bremen | 21.04% | 5.28%(+15.8)#21 | 11.22%(+9.82)#2,938 |
| 22. | Milford | 20.43% | 5.28%(+15.1)#22 | 11.22%(+9.21)#3,011 |
| 23. | Logansport | 20.38% | 5.28%(+15.1)#23 | 11.22%(+9.16)#3,021 |
| 24. | Benton | 19.93% | 5.28%(+14.6)#24 | 11.22%(+8.71)#3,086 |
| 25. | Lagrange | 19.73% | 5.28%(+14.4)#25 | 11.22%(+8.51)#3,111 |
| 26. | Otisco | 18.92% | 5.28%(+13.6)#26 | 11.22%(+7.70)#3,220 |
| 27. | Plymouth | 18.64% | 5.28%(+13.4)#27 | 11.22%(+7.42)#3,258 |
| 28. | Goshen | 18.23% | 5.28%(+12.9)#28 | 11.22%(+7.01)#3,315 |
| 29. | Boswell | 18.10% | 5.28%(+12.8)#29 | 11.22%(+6.88)#3,336 |
| 30. | Elkhart | 16.43% | 5.28%(+11.2)#30 | 11.22%(+5.21)#3,624 |
| 31. | Salamonia | 16.37% | 5.28%(+11.1)#31 | 11.22%(+5.16)#3,637 |
| 32. | Millersburg | 15.85% | 5.28%(+10.6)#32 | 11.22%(+4.63)#3,722 |
| 33. | Arcadia | 15.62% | 5.28%(+10.3)#33 | 11.22%(+4.40)#3,766 |
| 34. | Brooksburg | 15.25% | 5.28%(+9.97)#34 | 11.22%(+4.04)#3,838 |
| 35. | Union City | 14.70% | 5.28%(+9.41)#35 | 11.22%(+3.48)#3,951 |
| 36. | Portage | 14.31% | 5.28%(+9.03)#36 | 11.22%(+3.09)#4,045 |
| 37. | Delphi | 14.07% | 5.28%(+8.79)#37 | 11.22%(+2.85)#4,098 |
| 38. | Monterey | 13.77% | 5.28%(+8.49)#38 | 11.22%(+2.55)#4,162 |
| 39. | Dubois | 13.76% | 5.28%(+8.48)#39 | 11.22%(+2.54)#4,168 |
| 40. | South Bend | 13.70% | 5.28%(+8.42)#40 | 11.22%(+2.48)#4,183 |
| 41. | Griffith | 13.52% | 5.28%(+8.23)#41 | 11.22%(+2.30)#4,224 |
| 42. | Clermont | 13.30% | 5.28%(+8.02)#42 | 11.22%(+2.08)#4,276 |
| 43. | Winona Lake | 13.16% | 5.28%(+7.87)#43 | 11.22%(+1.94)#4,309 |
| 44. | Schererville | 13.00% | 5.28%(+7.72)#44 | 11.22%(+1.78)#4,338 |
| 45. | Nappanee | 12.70% | 5.28%(+7.42)#45 | 11.22%(+1.48)#4,420 |
| 46. | Burns Harbor | 12.45% | 5.28%(+7.17)#46 | 11.22%(+1.23)#4,476 |
| 47. | Merrillville | 12.24% | 5.28%(+6.95)#47 | 11.22%(+1.02)#4,541 |
| 48. | Lawrence | 11.97% | 5.28%(+6.68)#48 | 11.22%(+0.748)#4,619 |
| 49. | Clarksville | 11.85% | 5.28%(+6.57)#49 | 11.22%(+0.634)#4,641 |
| 50. | Hobart | 11.82% | 5.28%(+6.54)#50 | 11.22%(+0.606)#4,645 |
| 51. | Munster | 11.49% | 5.28%(+6.20)#51 | 11.22%(+0.268)#4,746 |
| 52. | Shorewood Forest | 11.14% | 5.28%(+5.85)#52 | 11.22%(-0.084)#4,856 |
| 53. | Monon | 10.94% | 5.28%(+5.66)#53 | 11.22%(-0.278)#4,913 |
| 54. | Porter | 10.88% | 5.28%(+5.59)#54 | 11.22%(-0.343)#4,938 |
| 55. | Roselawn | 10.74% | 5.28%(+5.46)#55 | 11.22%(-0.477)#4,985 |
| 56. | Redkey | 10.54% | 5.28%(+5.25)#56 | 11.22%(-0.683)#5,058 |
| 57. | Sidney | 10.53% | 5.28%(+5.24)#57 | 11.22%(-0.693)#5,066 |
| 58. | Ashley | 10.31% | 5.28%(+5.03)#58 | 11.22%(-0.911)#5,136 |
| 59. | Lafayette | 10.25% | 5.28%(+4.96)#59 | 11.22%(-0.973)#5,152 |
| 60. | La Porte | 9.86% | 5.28%(+4.58)#60 | 11.22%(-1.36)#5,305 |
| 61. | Russiaville | 9.56% | 5.28%(+4.28)#61 | 11.22%(-1.66)#5,433 |
| 62. | Hebron | 9.35% | 5.28%(+4.07)#62 | 11.22%(-1.87)#5,516 |
| 63. | Montezuma | 9.33% | 5.28%(+4.05)#63 | 11.22%(-1.89)#5,522 |
| 64. | St John | 9.26% | 5.28%(+3.98)#64 | 11.22%(-1.96)#5,557 |
| 65. | Dunlap | 9.13% | 5.28%(+3.85)#65 | 11.22%(-2.09)#5,606 |
| 66. | Lowell | 9.12% | 5.28%(+3.84)#66 | 11.22%(-2.10)#5,610 |
| 67. | Ogden Dunes | 9.11% | 5.28%(+3.82)#67 | 11.22%(-2.11)#5,613 |
| 68. | Dyer | 9.08% | 5.28%(+3.80)#68 | 11.22%(-2.14)#5,629 |
| 69. | Adams | 8.95% | 5.28%(+3.66)#69 | 11.22%(-2.27)#5,685 |
| 70. | Corunna | 8.76% | 5.28%(+3.48)#70 | 11.22%(-2.46)#5,761 |
| 71. | Romney | 8.60% | 5.28%(+3.31)#71 | 11.22%(-2.62)#5,847 |
| 72. | Seelyville | 8.49% | 5.28%(+3.21)#72 | 11.22%(-2.73)#5,903 |
| 73. | Warren Park | 8.47% | 5.28%(+3.19)#73 | 11.22%(-2.74)#5,907 |
| 74. | Roann | 8.42% | 5.28%(+3.13)#74 | 11.22%(-2.80)#5,940 |
| 75. | Crown Point | 8.31% | 5.28%(+3.03)#75 | 11.22%(-2.91)#5,999 |
| 76. | Leesburg | 8.28% | 5.28%(+3.00)#76 | 11.22%(-2.94)#6,020 |
| 77. | Blountsville | 8.26% | 5.28%(+2.97)#77 | 11.22%(-2.96)#6,034 |
| 78. | Windfall City | 8.24% | 5.28%(+2.96)#78 | 11.22%(-2.98)#6,042 |
| 79. | Seymour | 8.21% | 5.28%(+2.92)#79 | 11.22%(-3.01)#6,061 |
| 80. | Lake Dalecarlia | 8.08% | 5.28%(+2.80)#80 | 11.22%(-3.14)#6,129 |
| 81. | Orland | 8.07% | 5.28%(+2.79)#81 | 11.22%(-3.15)#6,134 |
| 82. | Malden | 8.03% | 5.28%(+2.74)#82 | 11.22%(-3.19)#6,164 |
| 83. | Holland | 8.01% | 5.28%(+2.72)#83 | 11.22%(-3.21)#6,173 |
| 84. | Morocco | 7.95% | 5.28%(+2.67)#84 | 11.22%(-3.27)#6,210 |
| 85. | Plainville | 7.92% | 5.28%(+2.64)#85 | 11.22%(-3.30)#6,223 |
| 86. | Washington | 7.77% | 5.28%(+2.48)#86 | 11.22%(-3.45)#6,299 |
| 87. | Wildwood | 7.75% | 5.28%(+2.46)#87 | 11.22%(-3.47)#6,316 |
| 88. | Salt Creek Commons | 7.71% | 5.28%(+2.43)#88 | 11.22%(-3.51)#6,330 |
| 89. | Wakarusa | 7.68% | 5.28%(+2.39)#89 | 11.22%(-3.54)#6,351 |
| 90. | Servia | 7.58% | 5.28%(+2.29)#90 | 11.22%(-3.64)#6,408 |
| 91. | Kentland | 7.51% | 5.28%(+2.23)#91 | 11.22%(-3.71)#6,437 |
| 92. | Indianapolis | 7.40% | 5.28%(+2.12)#92 | 11.22%(-3.82)#6,508 |
| 93. | Amboy | 7.39% | 5.28%(+2.11)#93 | 11.22%(-3.83)#6,514 |
| 94. | Shelbyville | 7.36% | 5.28%(+2.08)#94 | 11.22%(-3.86)#6,525 |
| 95. | Morgantown | 7.35% | 5.28%(+2.06)#95 | 11.22%(-3.87)#6,534 |
| 96. | Monroe | 7.34% | 5.28%(+2.06)#96 | 11.22%(-3.88)#6,537 |
| 97. | Decatur | 7.32% | 5.28%(+2.03)#97 | 11.22%(-3.90)#6,545 |
| 98. | Milroy | 7.29% | 5.28%(+2.01)#98 | 11.22%(-3.93)#6,558 |
| 99. | Fort Wayne | 7.24% | 5.28%(+1.95)#99 | 11.22%(-3.98)#6,594 |
| 100. | Warsaw | 7.19% | 5.28%(+1.91)#100 | 11.22%(-4.03)#6,619 |
Common Questions
What are the Top 10 Cities with the Highest Percentage of Mexican Population in Indiana?
Top 10 Cities with the Highest Percentage of Mexican Population in Indiana are:
#1
61.30%
#2
57.89%
#3
55.99%
#4
44.91%
#5
43.81%
#6
34.65%
#7
34.20%
#8
33.24%
#9
31.83%
#10
29.07%
What city has the Highest Percentage of Mexican Population in Indiana?
Ambia has the Highest Percentage of Mexican Population in Indiana with 61.30%.
What is the Percentage of Mexican Population in the State of Indiana?
Percentage of Mexican Population in Indiana is 5.28%.
What is the Percentage of Mexican Population in the United States?
Percentage of Mexican Population in the United States is 11.22%.