Cities with the Highest Percentage of Mexican Population in Florida
RELATED REPORTS & OPTIONS
Mexican
Florida
Compare Cities
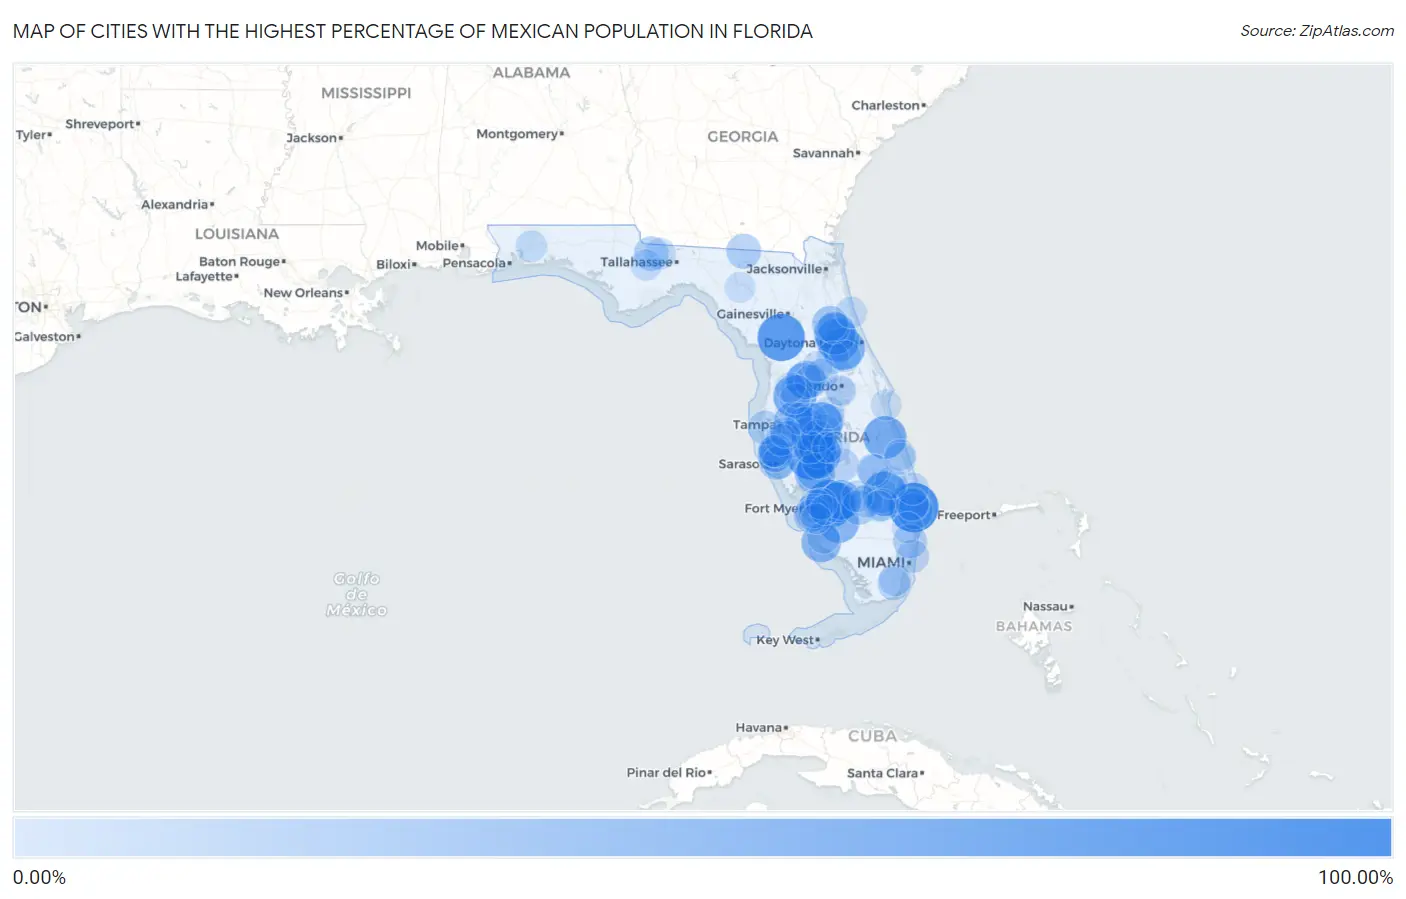
Map of Cities with the Highest Percentage of Mexican Population in Florida
0.00%
100.00%
Cities with the Highest Percentage of Mexican Population in Florida
| City | Mexican | vs State | vs National | |
| 1. | Acacia Villas | 85.95% | 3.36%(+82.6)#1 | 11.22%(+74.7)#407 |
| 2. | Ona | 84.37% | 3.36%(+81.0)#2 | 11.22%(+73.1)#432 |
| 3. | Charleston Park | 78.79% | 3.36%(+75.4)#3 | 11.22%(+67.6)#533 |
| 4. | Morriston | 77.14% | 3.36%(+73.8)#4 | 11.22%(+65.9)#559 |
| 5. | Canal Point | 65.45% | 3.36%(+62.1)#5 | 11.22%(+54.2)#787 |
| 6. | Zolfo Springs | 64.01% | 3.36%(+60.7)#6 | 11.22%(+52.8)#812 |
| 7. | Dade City North | 61.30% | 3.36%(+57.9)#7 | 11.22%(+50.1)#862 |
| 8. | Wahneta | 60.46% | 3.36%(+57.1)#8 | 11.22%(+49.2)#884 |
| 9. | Fellsmere | 59.73% | 3.36%(+56.4)#9 | 11.22%(+48.5)#901 |
| 10. | Pierson | 59.68% | 3.36%(+56.3)#10 | 11.22%(+48.5)#903 |
| 11. | De Leon Springs | 56.83% | 3.36%(+53.5)#11 | 11.22%(+45.6)#968 |
| 12. | Seville | 55.34% | 3.36%(+52.0)#12 | 11.22%(+44.1)#1,004 |
| 13. | Immokalee | 51.25% | 3.36%(+47.9)#13 | 11.22%(+40.0)#1,105 |
| 14. | Southeast Arcadia | 48.72% | 3.36%(+45.4)#14 | 11.22%(+37.5)#1,184 |
| 15. | Labelle | 47.47% | 3.36%(+44.1)#15 | 11.22%(+36.3)#1,229 |
| 16. | Naples Manor | 47.09% | 3.36%(+43.7)#16 | 11.22%(+35.9)#1,242 |
| 17. | Port Labelle | 46.93% | 3.36%(+43.6)#17 | 11.22%(+35.7)#1,249 |
| 18. | Dover | 44.53% | 3.36%(+41.2)#18 | 11.22%(+33.3)#1,355 |
| 19. | Bowling Green | 44.08% | 3.36%(+40.7)#19 | 11.22%(+32.9)#1,370 |
| 20. | Willow Oak | 42.96% | 3.36%(+39.6)#20 | 11.22%(+31.7)#1,407 |
| 21. | Center Hill | 41.72% | 3.36%(+38.4)#21 | 11.22%(+30.5)#1,461 |
| 22. | Ocala Estates | 40.87% | 3.36%(+37.5)#22 | 11.22%(+29.7)#1,492 |
| 23. | Wimauma | 40.53% | 3.36%(+37.2)#23 | 11.22%(+29.3)#1,507 |
| 24. | Wauchula | 37.53% | 3.36%(+34.2)#24 | 11.22%(+26.3)#1,641 |
| 25. | Pine Manor | 37.27% | 3.36%(+33.9)#25 | 11.22%(+26.1)#1,649 |
| 26. | Webster | 35.60% | 3.36%(+32.2)#26 | 11.22%(+24.4)#1,737 |
| 27. | Arcadia | 35.00% | 3.36%(+31.6)#27 | 11.22%(+23.8)#1,777 |
| 28. | Seminole Manor | 33.47% | 3.36%(+30.1)#28 | 11.22%(+22.2)#1,883 |
| 29. | Pomona Park | 32.10% | 3.36%(+28.7)#29 | 11.22%(+20.9)#1,983 |
| 30. | Montura | 28.56% | 3.36%(+25.2)#30 | 11.22%(+17.3)#2,223 |
| 31. | Jennings | 28.51% | 3.36%(+25.2)#31 | 11.22%(+17.3)#2,226 |
| 32. | North Sarasota | 28.33% | 3.36%(+25.0)#32 | 11.22%(+17.1)#2,245 |
| 33. | West Samoset | 28.19% | 3.36%(+24.8)#33 | 11.22%(+17.0)#2,257 |
| 34. | Greensboro | 27.56% | 3.36%(+24.2)#34 | 11.22%(+16.3)#2,313 |
| 35. | Alturas | 26.68% | 3.36%(+23.3)#35 | 11.22%(+15.5)#2,398 |
| 36. | Tice | 26.46% | 3.36%(+23.1)#36 | 11.22%(+15.2)#2,417 |
| 37. | Boulevard Gardens | 25.61% | 3.36%(+22.3)#37 | 11.22%(+14.4)#2,486 |
| 38. | Samoset | 25.60% | 3.36%(+22.2)#38 | 11.22%(+14.4)#2,491 |
| 39. | Pahokee | 25.27% | 3.36%(+21.9)#39 | 11.22%(+14.1)#2,533 |
| 40. | Memphis | 24.45% | 3.36%(+21.1)#40 | 11.22%(+13.2)#2,596 |
| 41. | South Highpoint | 24.30% | 3.36%(+20.9)#41 | 11.22%(+13.1)#2,611 |
| 42. | Bradley Junction | 24.23% | 3.36%(+20.9)#42 | 11.22%(+13.0)#2,621 |
| 43. | Ellenton | 23.56% | 3.36%(+20.2)#43 | 11.22%(+12.3)#2,684 |
| 44. | Taylor Creek | 23.08% | 3.36%(+19.7)#44 | 11.22%(+11.9)#2,723 |
| 45. | Indian Creek | 22.22% | 3.36%(+18.9)#45 | 11.22%(+11.0)#2,800 |
| 46. | Harlem Heights | 21.84% | 3.36%(+18.5)#46 | 11.22%(+10.6)#2,851 |
| 47. | Mascotte | 21.79% | 3.36%(+18.4)#47 | 11.22%(+10.6)#2,862 |
| 48. | Kensington Park | 21.63% | 3.36%(+18.3)#48 | 11.22%(+10.4)#2,879 |
| 49. | Plantation Mobile Home Park | 21.49% | 3.36%(+18.1)#49 | 11.22%(+10.3)#2,892 |
| 50. | Florida City | 21.39% | 3.36%(+18.0)#50 | 11.22%(+10.2)#2,906 |
| 51. | Lake Placid | 21.29% | 3.36%(+17.9)#51 | 11.22%(+10.1)#2,922 |
| 52. | Royal Palm Estates | 20.98% | 3.36%(+17.6)#52 | 11.22%(+9.76)#2,943 |
| 53. | Gardner | 20.89% | 3.36%(+17.5)#53 | 11.22%(+9.67)#2,954 |
| 54. | Leisure City | 20.15% | 3.36%(+16.8)#54 | 11.22%(+8.93)#3,062 |
| 55. | Paisley | 20.07% | 3.36%(+16.7)#55 | 11.22%(+8.86)#3,072 |
| 56. | Clewiston | 20.01% | 3.36%(+16.7)#56 | 11.22%(+8.79)#3,080 |
| 57. | Astatula | 19.98% | 3.36%(+16.6)#57 | 11.22%(+8.76)#3,081 |
| 58. | Lacoochee | 19.59% | 3.36%(+16.2)#58 | 11.22%(+8.37)#3,136 |
| 59. | Crescent City | 19.56% | 3.36%(+16.2)#59 | 11.22%(+8.34)#3,140 |
| 60. | Belle Glade | 19.51% | 3.36%(+16.1)#60 | 11.22%(+8.29)#3,153 |
| 61. | Limestone Creek | 19.45% | 3.36%(+16.1)#61 | 11.22%(+8.23)#3,159 |
| 62. | Indiantown | 19.43% | 3.36%(+16.1)#62 | 11.22%(+8.21)#3,162 |
| 63. | Fort Meade | 19.25% | 3.36%(+15.9)#63 | 11.22%(+8.03)#3,179 |
| 64. | Fort Pierce South | 19.01% | 3.36%(+15.6)#64 | 11.22%(+7.79)#3,210 |
| 65. | Golden Gate | 18.83% | 3.36%(+15.5)#65 | 11.22%(+7.61)#3,231 |
| 66. | Okeechobee | 18.76% | 3.36%(+15.4)#66 | 11.22%(+7.54)#3,240 |
| 67. | Fort Green Springs | 18.32% | 3.36%(+15.0)#67 | 11.22%(+7.11)#3,301 |
| 68. | Ruskin | 17.79% | 3.36%(+14.4)#68 | 11.22%(+6.57)#3,379 |
| 69. | Plant City | 17.55% | 3.36%(+14.2)#69 | 11.22%(+6.33)#3,424 |
| 70. | Dundee | 17.51% | 3.36%(+14.2)#70 | 11.22%(+6.29)#3,430 |
| 71. | Pensacola Station | 17.43% | 3.36%(+14.1)#71 | 11.22%(+6.21)#3,442 |
| 72. | Palmetto | 17.38% | 3.36%(+14.0)#72 | 11.22%(+6.16)#3,447 |
| 73. | Quincy | 17.30% | 3.36%(+13.9)#73 | 11.22%(+6.08)#3,462 |
| 74. | Crystal Lake | 17.13% | 3.36%(+13.8)#74 | 11.22%(+5.91)#3,497 |
| 75. | Deland Southwest | 17.11% | 3.36%(+13.8)#75 | 11.22%(+5.89)#3,501 |
| 76. | Haines City | 16.73% | 3.36%(+13.4)#76 | 11.22%(+5.52)#3,573 |
| 77. | Marineland | 16.67% | 3.36%(+13.3)#77 | 11.22%(+5.45)#3,588 |
| 78. | Page Park | 16.47% | 3.36%(+13.1)#78 | 11.22%(+5.25)#3,610 |
| 79. | Harold | 16.45% | 3.36%(+13.1)#79 | 11.22%(+5.24)#3,616 |
| 80. | Moore Haven | 16.42% | 3.36%(+13.1)#80 | 11.22%(+5.20)#3,625 |
| 81. | Avon Park | 15.89% | 3.36%(+12.5)#81 | 11.22%(+4.67)#3,718 |
| 82. | Hosford | 15.80% | 3.36%(+12.4)#82 | 11.22%(+4.58)#3,733 |
| 83. | South Bay | 15.76% | 3.36%(+12.4)#83 | 11.22%(+4.54)#3,738 |
| 84. | Fort Myers Shores | 15.66% | 3.36%(+12.3)#84 | 11.22%(+4.44)#3,752 |
| 85. | Fort Pierce North | 15.57% | 3.36%(+12.2)#85 | 11.22%(+4.35)#3,774 |
| 86. | Watergate | 15.55% | 3.36%(+12.2)#86 | 11.22%(+4.33)#3,781 |
| 87. | Patrick Afb | 14.20% | 3.36%(+10.8)#87 | 11.22%(+2.98)#4,070 |
| 88. | Mayo | 13.85% | 3.36%(+10.5)#88 | 11.22%(+2.63)#4,147 |
| 89. | Lemon Grove | 13.44% | 3.36%(+10.1)#89 | 11.22%(+2.22)#4,242 |
| 90. | Vero Lake Estates | 13.06% | 3.36%(+9.70)#90 | 11.22%(+1.84)#4,324 |
| 91. | Silver Lake | 13.03% | 3.36%(+9.68)#91 | 11.22%(+1.82)#4,331 |
| 92. | Gibsonton | 12.95% | 3.36%(+9.59)#92 | 11.22%(+1.73)#4,349 |
| 93. | Dade City | 12.67% | 3.36%(+9.31)#93 | 11.22%(+1.45)#4,426 |
| 94. | Hurlburt Field | 12.52% | 3.36%(+9.16)#94 | 11.22%(+1.30)#4,459 |
| 95. | Oak Ridge | 12.44% | 3.36%(+9.09)#95 | 11.22%(+1.23)#4,479 |
| 96. | Hill N Dale | 12.06% | 3.36%(+8.70)#96 | 11.22%(+0.841)#4,591 |
| 97. | San Carlos Park | 11.79% | 3.36%(+8.43)#97 | 11.22%(+0.572)#4,651 |
| 98. | Whitfield Cdp Manatee County | 11.59% | 3.36%(+8.23)#98 | 11.22%(+0.370)#4,712 |
| 99. | Lehigh Acres | 11.32% | 3.36%(+7.96)#99 | 11.22%(+0.100)#4,800 |
| 100. | Sky Lake | 11.19% | 3.36%(+7.84)#100 | 11.22%(-0.026)#4,846 |
Common Questions
What are the Top 10 Cities with the Highest Percentage of Mexican Population in Florida?
Top 10 Cities with the Highest Percentage of Mexican Population in Florida are:
#1
85.95%
#2
84.37%
#3
78.79%
#4
77.14%
#5
65.45%
#6
64.01%
#7
61.30%
#8
60.46%
#9
59.73%
#10
59.68%
What city has the Highest Percentage of Mexican Population in Florida?
Acacia Villas has the Highest Percentage of Mexican Population in Florida with 85.95%.
What is the Percentage of Mexican Population in the State of Florida?
Percentage of Mexican Population in Florida is 3.36%.
What is the Percentage of Mexican Population in the United States?
Percentage of Mexican Population in the United States is 11.22%.