Cities with the Highest Percentage of Mexican Population in Connecticut
RELATED REPORTS & OPTIONS
Mexican
Connecticut
Compare Cities
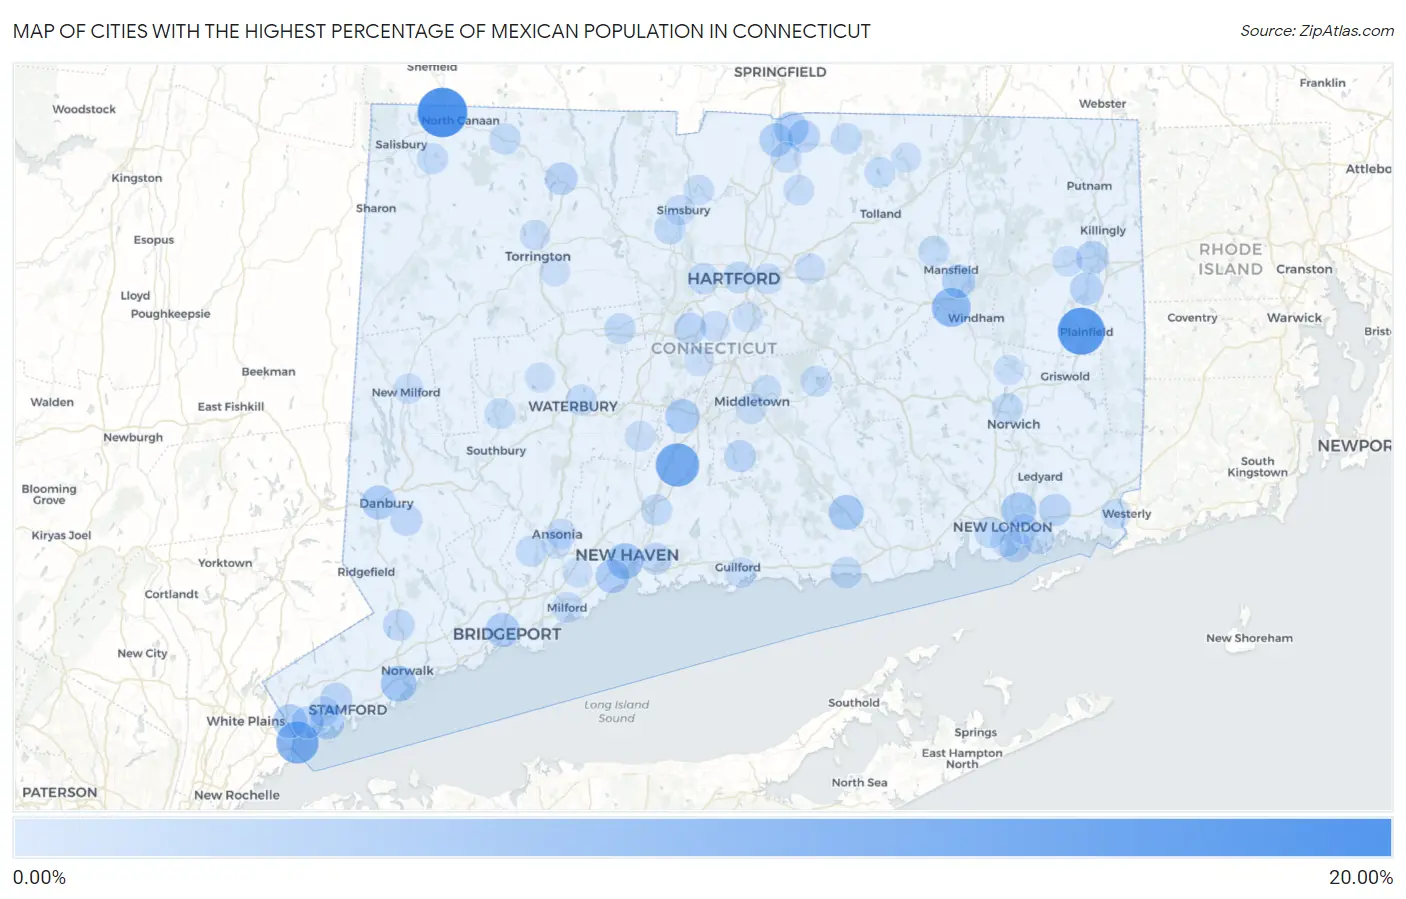
Map of Cities with the Highest Percentage of Mexican Population in Connecticut
0.00%
20.00%
Cities with the Highest Percentage of Mexican Population in Connecticut
| City | Mexican | vs State | vs National | |
| 1. | Canaan | 18.33% | 1.74%(+16.6)#1 | 11.22%(+7.11)#3,298 |
| 2. | Plainfield Village | 15.81% | 1.74%(+14.1)#2 | 11.22%(+4.60)#3,730 |
| 3. | Wallingford Center | 12.44% | 1.74%(+10.7)#3 | 11.22%(+1.22)#4,480 |
| 4. | Byram | 11.24% | 1.74%(+9.50)#4 | 11.22%(+0.020)#4,831 |
| 5. | Willimantic | 8.20% | 1.74%(+6.47)#5 | 11.22%(-3.02)#6,063 |
| 6. | New Haven | 5.62% | 1.74%(+3.88)#6 | 11.22%(-5.60)#7,752 |
| 7. | Norwalk | 5.40% | 1.74%(+3.67)#7 | 11.22%(-5.82)#7,940 |
| 8. | Stonington Borough | 5.10% | 1.74%(+3.36)#8 | 11.22%(-6.12)#8,252 |
| 9. | Danielson Borough | 4.85% | 1.74%(+3.12)#9 | 11.22%(-6.37)#8,489 |
| 10. | Conning Towers Nautilus Park | 4.83% | 1.74%(+3.09)#10 | 11.22%(-6.39)#8,523 |
| 11. | Deep River Center | 4.67% | 1.74%(+2.93)#11 | 11.22%(-6.55)#8,708 |
| 12. | Meriden | 4.20% | 1.74%(+2.46)#12 | 11.22%(-7.02)#9,237 |
| 13. | Sherwood Manor | 4.01% | 1.74%(+2.28)#13 | 11.22%(-7.21)#9,446 |
| 14. | Bridgeport | 3.94% | 1.74%(+2.20)#14 | 11.22%(-7.28)#9,516 |
| 15. | West Haven | 3.93% | 1.74%(+2.19)#15 | 11.22%(-7.29)#9,523 |
| 16. | Danbury | 3.86% | 1.74%(+2.13)#16 | 11.22%(-7.35)#9,605 |
| 17. | Glenville | 3.82% | 1.74%(+2.09)#17 | 11.22%(-7.40)#9,652 |
| 18. | Riverside | 3.73% | 1.74%(+1.99)#18 | 11.22%(-7.49)#9,780 |
| 19. | Mansfield Center | 3.51% | 1.74%(+1.78)#19 | 11.22%(-7.71)#10,097 |
| 20. | Thompsonville | 3.50% | 1.74%(+1.76)#20 | 11.22%(-7.72)#10,124 |
| 21. | Saugatuck | 3.07% | 1.74%(+1.33)#21 | 11.22%(-8.15)#10,793 |
| 22. | East Brooklyn | 2.88% | 1.74%(+1.14)#22 | 11.22%(-8.34)#11,147 |
| 23. | Winsted | 2.59% | 1.74%(+0.850)#23 | 11.22%(-8.63)#11,707 |
| 24. | Wauregan | 2.58% | 1.74%(+0.842)#24 | 11.22%(-8.64)#11,727 |
| 25. | Greens Farms | 2.36% | 1.74%(+0.624)#25 | 11.22%(-8.86)#12,198 |
| 26. | Hazardville | 2.34% | 1.74%(+0.599)#26 | 11.22%(-8.88)#12,247 |
| 27. | Greenwich | 2.33% | 1.74%(+0.598)#27 | 11.22%(-8.88)#12,250 |
| 28. | Old Mystic | 2.33% | 1.74%(+0.597)#28 | 11.22%(-8.89)#12,252 |
| 29. | Lakes West | 2.28% | 1.74%(+0.546)#29 | 11.22%(-8.94)#12,359 |
| 30. | Stamford | 2.19% | 1.74%(+0.448)#30 | 11.22%(-9.03)#12,580 |
| 31. | Durham | 2.16% | 1.74%(+0.425)#31 | 11.22%(-9.06)#12,654 |
| 32. | Groton | 2.14% | 1.74%(+0.399)#32 | 11.22%(-9.08)#12,716 |
| 33. | Gaylordsville | 2.04% | 1.74%(+0.308)#33 | 11.22%(-9.17)#12,941 |
| 34. | New Britain | 2.01% | 1.74%(+0.276)#34 | 11.22%(-9.21)#13,023 |
| 35. | Bethel | 1.93% | 1.74%(+0.194)#35 | 11.22%(-9.29)#13,254 |
| 36. | Candlewood Shores | 1.89% | 1.74%(+0.157)#36 | 11.22%(-9.33)#13,351 |
| 37. | East Haven | 1.83% | 1.74%(+0.089)#37 | 11.22%(-9.39)#13,515 |
| 38. | Sacred Heart University | 1.81% | 1.74%(+0.076)#38 | 11.22%(-9.41)#13,554 |
| 39. | Wilton Center | 1.77% | 1.74%(+0.029)#39 | 11.22%(-9.45)#13,660 |
| 40. | Hartford | 1.72% | 1.74%(-0.018)#40 | 11.22%(-9.50)#13,778 |
| 41. | Tokeneke | 1.71% | 1.74%(-0.028)#41 | 11.22%(-9.51)#13,810 |
| 42. | Weatogue | 1.61% | 1.74%(-0.127)#42 | 11.22%(-9.61)#14,082 |
| 43. | Westbrook Center | 1.60% | 1.74%(-0.140)#43 | 11.22%(-9.62)#14,129 |
| 44. | West Hartford | 1.57% | 1.74%(-0.166)#44 | 11.22%(-9.65)#14,201 |
| 45. | Litchfield Borough | 1.55% | 1.74%(-0.187)#45 | 11.22%(-9.67)#14,273 |
| 46. | New London | 1.48% | 1.74%(-0.258)#46 | 11.22%(-9.74)#14,444 |
| 47. | Bristol | 1.46% | 1.74%(-0.276)#47 | 11.22%(-9.76)#14,499 |
| 48. | North Haven | 1.44% | 1.74%(-0.298)#48 | 11.22%(-9.78)#14,549 |
| 49. | Norwich | 1.40% | 1.74%(-0.334)#49 | 11.22%(-9.82)#14,653 |
| 50. | Noroton | 1.39% | 1.74%(-0.345)#50 | 11.22%(-9.83)#14,696 |
| 51. | Norfolk | 1.38% | 1.74%(-0.356)#51 | 11.22%(-9.84)#14,724 |
| 52. | Waterford | 1.37% | 1.74%(-0.363)#52 | 11.22%(-9.85)#14,740 |
| 53. | Somers | 1.30% | 1.74%(-0.437)#53 | 11.22%(-9.92)#15,000 |
| 54. | Lake Pocotopaug | 1.28% | 1.74%(-0.456)#54 | 11.22%(-9.94)#15,057 |
| 55. | Falls Village | 1.27% | 1.74%(-0.468)#55 | 11.22%(-9.95)#15,081 |
| 56. | Shelton | 1.24% | 1.74%(-0.492)#56 | 11.22%(-9.97)#15,174 |
| 57. | Storrs | 1.24% | 1.74%(-0.499)#57 | 11.22%(-9.98)#15,198 |
| 58. | Poquonock Bridge | 1.22% | 1.74%(-0.514)#58 | 11.22%(-10.00)#15,250 |
| 59. | Waterbury | 1.16% | 1.74%(-0.577)#59 | 11.22%(-10.1)#15,457 |
| 60. | Sandy Hook | 1.13% | 1.74%(-0.602)#60 | 11.22%(-10.1)#15,538 |
| 61. | Crystal Lake | 1.11% | 1.74%(-0.631)#61 | 11.22%(-10.1)#15,631 |
| 62. | Milford City Balance | 1.08% | 1.74%(-0.653)#62 | 11.22%(-10.1)#15,712 |
| 63. | Noroton Heights | 1.03% | 1.74%(-0.706)#63 | 11.22%(-10.2)#15,895 |
| 64. | East Hartford | 0.99% | 1.74%(-0.744)#64 | 11.22%(-10.2)#16,069 |
| 65. | Woodbury Center | 0.97% | 1.74%(-0.768)#65 | 11.22%(-10.3)#16,162 |
| 66. | Staples | 0.90% | 1.74%(-0.834)#66 | 11.22%(-10.3)#16,403 |
| 67. | Middletown | 0.90% | 1.74%(-0.838)#67 | 11.22%(-10.3)#16,417 |
| 68. | Tariffville | 0.89% | 1.74%(-0.849)#68 | 11.22%(-10.3)#16,466 |
| 69. | Cos Cob | 0.87% | 1.74%(-0.867)#69 | 11.22%(-10.3)#16,531 |
| 70. | Oronoque | 0.86% | 1.74%(-0.876)#70 | 11.22%(-10.4)#16,566 |
| 71. | Southwood Acres | 0.85% | 1.74%(-0.892)#71 | 11.22%(-10.4)#16,632 |
| 72. | Plattsville | 0.80% | 1.74%(-0.938)#72 | 11.22%(-10.4)#16,812 |
| 73. | Brooklyn | 0.79% | 1.74%(-0.947)#73 | 11.22%(-10.4)#16,850 |
| 74. | Broad Brook | 0.77% | 1.74%(-0.963)#74 | 11.22%(-10.4)#16,930 |
| 75. | Newington | 0.74% | 1.74%(-1.00)#75 | 11.22%(-10.5)#17,087 |
| 76. | Torrington | 0.73% | 1.74%(-1.00)#76 | 11.22%(-10.5)#17,103 |
| 77. | Manchester | 0.73% | 1.74%(-1.00)#77 | 11.22%(-10.5)#17,104 |
| 78. | Simsbury Center | 0.72% | 1.74%(-1.02)#78 | 11.22%(-10.5)#17,148 |
| 79. | Cheshire Village | 0.71% | 1.74%(-1.02)#79 | 11.22%(-10.5)#17,171 |
| 80. | Ansonia | 0.68% | 1.74%(-1.06)#80 | 11.22%(-10.5)#17,319 |
| 81. | Guilford Center | 0.67% | 1.74%(-1.07)#81 | 11.22%(-10.6)#17,337 |
| 82. | Jewett City Borough | 0.64% | 1.74%(-1.09)#82 | 11.22%(-10.6)#17,435 |
| 83. | Naugatuck Borough | 0.64% | 1.74%(-1.10)#83 | 11.22%(-10.6)#17,458 |
| 84. | New Milford | 0.62% | 1.74%(-1.12)#84 | 11.22%(-10.6)#17,544 |
| 85. | Westport | 0.56% | 1.74%(-1.17)#85 | 11.22%(-10.7)#17,801 |
| 86. | Long Hill | 0.55% | 1.74%(-1.18)#86 | 11.22%(-10.7)#17,837 |
| 87. | Pawcatuck | 0.54% | 1.74%(-1.20)#87 | 11.22%(-10.7)#17,882 |
| 88. | Portland | 0.51% | 1.74%(-1.22)#88 | 11.22%(-10.7)#17,986 |
| 89. | Trumbull Center | 0.50% | 1.74%(-1.23)#89 | 11.22%(-10.7)#18,038 |
| 90. | Newtown Borough | 0.46% | 1.74%(-1.28)#90 | 11.22%(-10.8)#18,237 |
| 91. | Baltic | 0.43% | 1.74%(-1.30)#91 | 11.22%(-10.8)#18,370 |
| 92. | Ball Pond | 0.43% | 1.74%(-1.30)#92 | 11.22%(-10.8)#18,373 |
| 93. | Kensington | 0.43% | 1.74%(-1.31)#93 | 11.22%(-10.8)#18,402 |
| 94. | Derby | 0.42% | 1.74%(-1.32)#94 | 11.22%(-10.8)#18,431 |
| 95. | Watertown | 0.40% | 1.74%(-1.34)#95 | 11.22%(-10.8)#18,505 |
| 96. | Northwest Harwinton | 0.37% | 1.74%(-1.36)#96 | 11.22%(-10.8)#18,603 |
| 97. | Orange | 0.37% | 1.74%(-1.36)#97 | 11.22%(-10.8)#18,614 |
| 98. | Wethersfield | 0.35% | 1.74%(-1.39)#98 | 11.22%(-10.9)#18,744 |
| 99. | Stafford Springs | 0.31% | 1.74%(-1.43)#99 | 11.22%(-10.9)#18,913 |
| 100. | Quinnipiac University | 0.30% | 1.74%(-1.43)#100 | 11.22%(-10.9)#18,925 |
1
2Common Questions
What are the Top 10 Cities with the Highest Percentage of Mexican Population in Connecticut?
Top 10 Cities with the Highest Percentage of Mexican Population in Connecticut are:
#1
18.33%
#2
15.81%
#3
12.44%
#4
11.24%
#5
8.20%
#6
5.62%
#7
5.40%
#8
4.83%
#9
4.67%
#10
4.20%
What city has the Highest Percentage of Mexican Population in Connecticut?
Canaan has the Highest Percentage of Mexican Population in Connecticut with 18.33%.
What is the Percentage of Mexican Population in the State of Connecticut?
Percentage of Mexican Population in Connecticut is 1.74%.
What is the Percentage of Mexican Population in the United States?
Percentage of Mexican Population in the United States is 11.22%.