Cities with the Highest Percentage of Mexican Population in Pennsylvania
RELATED REPORTS & OPTIONS
Mexican
Pennsylvania
Compare Cities
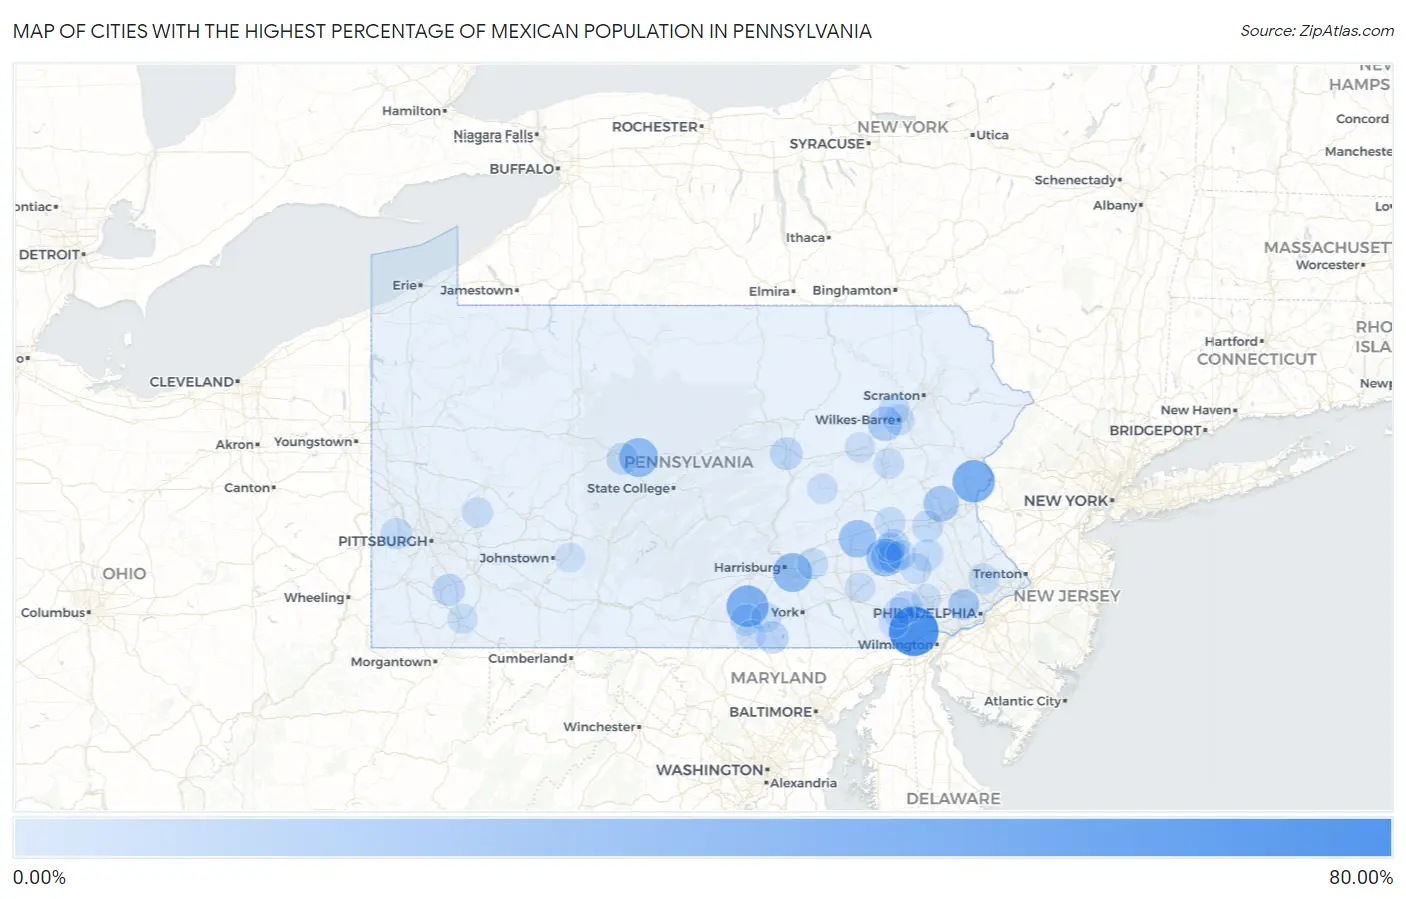
Map of Cities with the Highest Percentage of Mexican Population in Pennsylvania
0.00%
80.00%
Cities with the Highest Percentage of Mexican Population in Pennsylvania
| City | Mexican | vs State | vs National | |
| 1. | Toughkenamon | 60.81% | 1.31%(+59.5)#1 | 11.22%(+49.6)#875 |
| 2. | Avondale Borough | 47.29% | 1.31%(+46.0)#2 | 11.22%(+36.1)#1,238 |
| 3. | Ackermanville | 39.64% | 1.31%(+38.3)#3 | 11.22%(+28.4)#1,542 |
| 4. | York Springs Borough | 38.39% | 1.31%(+37.1)#4 | 11.22%(+27.2)#1,595 |
| 5. | Gardners | 38.14% | 1.31%(+36.8)#5 | 11.22%(+26.9)#1,608 |
| 6. | Kennett Square Borough | 30.22% | 1.31%(+28.9)#6 | 11.22%(+19.0)#2,108 |
| 7. | Bressler | 29.86% | 1.31%(+28.6)#7 | 11.22%(+18.6)#2,135 |
| 8. | Kylertown | 29.15% | 1.31%(+27.8)#8 | 11.22%(+17.9)#2,183 |
| 9. | S N P J Borough | 27.78% | 1.31%(+26.5)#9 | 11.22%(+16.6)#2,295 |
| 10. | Bendersville Borough | 27.14% | 1.31%(+25.8)#10 | 11.22%(+15.9)#2,359 |
| 11. | Springmont | 26.33% | 1.31%(+25.0)#11 | 11.22%(+15.1)#2,429 |
| 12. | Rehrersburg | 25.17% | 1.31%(+23.9)#12 | 11.22%(+13.9)#2,543 |
| 13. | Cementon | 20.22% | 1.31%(+18.9)#13 | 11.22%(+9.00)#3,053 |
| 14. | West Grove Borough | 20.04% | 1.31%(+18.7)#14 | 11.22%(+8.82)#3,077 |
| 15. | Gratz Borough | 19.39% | 1.31%(+18.1)#15 | 11.22%(+8.17)#3,165 |
| 16. | Oxford Borough | 19.10% | 1.31%(+17.8)#16 | 11.22%(+7.88)#3,197 |
| 17. | Nottingham | 16.92% | 1.31%(+15.6)#17 | 11.22%(+5.70)#3,536 |
| 18. | West Nanticoke | 16.86% | 1.31%(+15.5)#18 | 11.22%(+5.64)#3,553 |
| 19. | New Oxford Borough | 16.57% | 1.31%(+15.3)#19 | 11.22%(+5.35)#3,600 |
| 20. | Windsor Borough | 16.47% | 1.31%(+15.2)#20 | 11.22%(+5.25)#3,611 |
| 21. | Norristown Borough | 15.44% | 1.31%(+14.1)#21 | 11.22%(+4.22)#3,802 |
| 22. | Casanova | 13.15% | 1.31%(+11.8)#22 | 11.22%(+1.93)#4,311 |
| 23. | Biglerville Borough | 11.71% | 1.31%(+10.4)#23 | 11.22%(+0.487)#4,674 |
| 24. | Coatesville | 11.63% | 1.31%(+10.3)#24 | 11.22%(+0.406)#4,698 |
| 25. | West Milton | 11.42% | 1.31%(+10.1)#25 | 11.22%(+0.196)#4,771 |
| 26. | Pennville | 10.67% | 1.31%(+9.36)#26 | 11.22%(-0.546)#5,004 |
| 27. | Fairhope | 10.61% | 1.31%(+9.30)#27 | 11.22%(-0.604)#5,022 |
| 28. | Colony Park | 10.25% | 1.31%(+8.94)#28 | 11.22%(-0.970)#5,150 |
| 29. | Girard Borough | 10.16% | 1.31%(+8.85)#29 | 11.22%(-1.06)#5,187 |
| 30. | Reading | 10.14% | 1.31%(+8.83)#30 | 11.22%(-1.08)#5,198 |
| 31. | Valley View Cdp York County | 9.73% | 1.31%(+8.42)#31 | 11.22%(-1.49)#5,364 |
| 32. | West Lawn | 9.59% | 1.31%(+8.28)#32 | 11.22%(-1.63)#5,416 |
| 33. | Quakertown Borough | 9.52% | 1.31%(+8.21)#33 | 11.22%(-1.70)#5,454 |
| 34. | Bigler | 9.45% | 1.31%(+8.14)#34 | 11.22%(-1.77)#5,475 |
| 35. | Temple | 9.15% | 1.31%(+7.84)#35 | 11.22%(-2.07)#5,593 |
| 36. | Franklin Borough | 9.03% | 1.31%(+7.72)#36 | 11.22%(-2.19)#5,659 |
| 37. | Mont Clare | 9.02% | 1.31%(+7.71)#37 | 11.22%(-2.19)#5,662 |
| 38. | Table Rock | 9.00% | 1.31%(+7.69)#38 | 11.22%(-2.22)#5,670 |
| 39. | Haysville Borough | 8.87% | 1.31%(+7.56)#39 | 11.22%(-2.35)#5,717 |
| 40. | Troy Borough | 8.81% | 1.31%(+7.49)#40 | 11.22%(-2.41)#5,741 |
| 41. | Gettysburg Borough | 8.41% | 1.31%(+7.09)#41 | 11.22%(-2.81)#5,949 |
| 42. | Clinton | 8.33% | 1.31%(+7.02)#42 | 11.22%(-2.89)#5,978 |
| 43. | Breinigsville | 8.07% | 1.31%(+6.76)#43 | 11.22%(-3.15)#6,139 |
| 44. | New Berlinville | 8.03% | 1.31%(+6.72)#44 | 11.22%(-3.18)#6,160 |
| 45. | Shillington Borough | 7.79% | 1.31%(+6.47)#45 | 11.22%(-3.43)#6,293 |
| 46. | Chambersburg Borough | 7.64% | 1.31%(+6.33)#46 | 11.22%(-3.58)#6,370 |
| 47. | Wilkes Barre | 7.59% | 1.31%(+6.28)#47 | 11.22%(-3.62)#6,397 |
| 48. | Hershey | 7.51% | 1.31%(+6.20)#48 | 11.22%(-3.71)#6,439 |
| 49. | Glen Rock Borough | 7.40% | 1.31%(+6.09)#49 | 11.22%(-3.82)#6,506 |
| 50. | Bridgeport Borough | 7.32% | 1.31%(+6.01)#50 | 11.22%(-3.90)#6,541 |
| 51. | Edenburg | 7.25% | 1.31%(+5.94)#51 | 11.22%(-3.97)#6,586 |
| 52. | Trucksville | 7.24% | 1.31%(+5.93)#52 | 11.22%(-3.97)#6,589 |
| 53. | Atglen Borough | 7.24% | 1.31%(+5.93)#53 | 11.22%(-3.98)#6,591 |
| 54. | Arendtsville Borough | 7.11% | 1.31%(+5.79)#54 | 11.22%(-4.11)#6,665 |
| 55. | West Reading Borough | 7.08% | 1.31%(+5.77)#55 | 11.22%(-4.14)#6,686 |
| 56. | Pomeroy | 7.05% | 1.31%(+5.74)#56 | 11.22%(-4.17)#6,697 |
| 57. | Laureldale Borough | 7.01% | 1.31%(+5.70)#57 | 11.22%(-4.21)#6,725 |
| 58. | Douglassville | 6.96% | 1.31%(+5.65)#58 | 11.22%(-4.26)#6,749 |
| 59. | Horsham | 6.93% | 1.31%(+5.62)#59 | 11.22%(-4.29)#6,767 |
| 60. | Bryn Mawr | 6.79% | 1.31%(+5.48)#60 | 11.22%(-4.43)#6,860 |
| 61. | Hanover Borough | 6.79% | 1.31%(+5.48)#61 | 11.22%(-4.43)#6,861 |
| 62. | Paint Borough | 6.60% | 1.31%(+5.28)#62 | 11.22%(-4.62)#6,995 |
| 63. | Parkesburg Borough | 6.43% | 1.31%(+5.12)#63 | 11.22%(-4.79)#7,115 |
| 64. | West Homestead Borough | 6.41% | 1.31%(+5.10)#64 | 11.22%(-4.81)#7,132 |
| 65. | Meshoppen Borough | 6.33% | 1.31%(+5.02)#65 | 11.22%(-4.88)#7,190 |
| 66. | Haverford College | 6.29% | 1.31%(+4.98)#66 | 11.22%(-4.93)#7,236 |
| 67. | Hyde Park | 6.26% | 1.31%(+4.95)#67 | 11.22%(-4.96)#7,251 |
| 68. | Chadds Ford | 6.00% | 1.31%(+4.69)#68 | 11.22%(-5.22)#7,437 |
| 69. | Hazleton | 5.98% | 1.31%(+4.67)#69 | 11.22%(-5.24)#7,453 |
| 70. | Cochranville | 5.94% | 1.31%(+4.63)#70 | 11.22%(-5.28)#7,489 |
| 71. | Fox Chase | 5.67% | 1.31%(+4.36)#71 | 11.22%(-5.55)#7,714 |
| 72. | Shamokin | 5.67% | 1.31%(+4.36)#72 | 11.22%(-5.55)#7,716 |
| 73. | Chicora Borough | 5.48% | 1.31%(+4.16)#73 | 11.22%(-5.74)#7,881 |
| 74. | West Hazleton Borough | 5.38% | 1.31%(+4.07)#74 | 11.22%(-5.84)#7,968 |
| 75. | Brownstown | 5.30% | 1.31%(+3.99)#75 | 11.22%(-5.91)#8,047 |
| 76. | Fleetwood Borough | 5.29% | 1.31%(+3.98)#76 | 11.22%(-5.93)#8,067 |
| 77. | Sylvania Borough | 5.28% | 1.31%(+3.97)#77 | 11.22%(-5.93)#8,071 |
| 78. | York Haven Borough | 5.25% | 1.31%(+3.94)#78 | 11.22%(-5.97)#8,103 |
| 79. | Tamaqua Borough | 5.19% | 1.31%(+3.88)#79 | 11.22%(-6.02)#8,158 |
| 80. | East Berwick | 5.12% | 1.31%(+3.81)#80 | 11.22%(-6.09)#8,218 |
| 81. | Oliver | 5.12% | 1.31%(+3.81)#81 | 11.22%(-6.09)#8,219 |
| 82. | Delta Borough | 5.10% | 1.31%(+3.79)#82 | 11.22%(-6.12)#8,245 |
| 83. | Hayti | 5.07% | 1.31%(+3.76)#83 | 11.22%(-6.15)#8,278 |
| 84. | New Paris Borough | 5.07% | 1.31%(+3.76)#84 | 11.22%(-6.15)#8,281 |
| 85. | Waynesboro Borough | 5.06% | 1.31%(+3.75)#85 | 11.22%(-6.16)#8,290 |
| 86. | Stony Creek Mills | 4.97% | 1.31%(+3.66)#86 | 11.22%(-6.25)#8,384 |
| 87. | Hampton | 4.94% | 1.31%(+3.63)#87 | 11.22%(-6.28)#8,409 |
| 88. | Waymart Borough | 4.89% | 1.31%(+3.58)#88 | 11.22%(-6.33)#8,454 |
| 89. | Wayne | 4.80% | 1.31%(+3.48)#89 | 11.22%(-6.42)#8,550 |
| 90. | Mount Holly Springs Borough | 4.69% | 1.31%(+3.38)#90 | 11.22%(-6.53)#8,684 |
| 91. | Lake Heritage | 4.65% | 1.31%(+3.34)#91 | 11.22%(-6.57)#8,731 |
| 92. | Milford Borough | 4.64% | 1.31%(+3.33)#92 | 11.22%(-6.57)#8,735 |
| 93. | Irvona Borough | 4.63% | 1.31%(+3.32)#93 | 11.22%(-6.59)#8,753 |
| 94. | Hummelstown Borough | 4.56% | 1.31%(+3.25)#94 | 11.22%(-6.66)#8,830 |
| 95. | University Of Pittsburgh Bradford | 4.56% | 1.31%(+3.24)#95 | 11.22%(-6.66)#8,840 |
| 96. | Eagleville Cdp Montgomery County | 4.53% | 1.31%(+3.22)#96 | 11.22%(-6.69)#8,866 |
| 97. | Spring Grove Borough | 4.53% | 1.31%(+3.22)#97 | 11.22%(-6.69)#8,869 |
| 98. | White Haven Borough | 4.49% | 1.31%(+3.18)#98 | 11.22%(-6.72)#8,908 |
| 99. | St Michael | 4.47% | 1.31%(+3.16)#99 | 11.22%(-6.75)#8,931 |
| 100. | Lionville | 4.39% | 1.31%(+3.08)#100 | 11.22%(-6.83)#9,022 |
Common Questions
What are the Top 10 Cities with the Highest Percentage of Mexican Population in Pennsylvania?
Top 10 Cities with the Highest Percentage of Mexican Population in Pennsylvania are:
#1
60.81%
#2
39.64%
#3
38.14%
#4
29.86%
#5
29.15%
#6
26.33%
#7
25.17%
#8
20.22%
#9
16.86%
#10
11.63%
What city has the Highest Percentage of Mexican Population in Pennsylvania?
Toughkenamon has the Highest Percentage of Mexican Population in Pennsylvania with 60.81%.
What is the Percentage of Mexican Population in the State of Pennsylvania?
Percentage of Mexican Population in Pennsylvania is 1.31%.
What is the Percentage of Mexican Population in the United States?
Percentage of Mexican Population in the United States is 11.22%.