Cities with the Highest Percentage of Immigrants from Oceania in Kentucky
RELATED REPORTS & OPTIONS
Oceania
Kentucky
Compare Cities
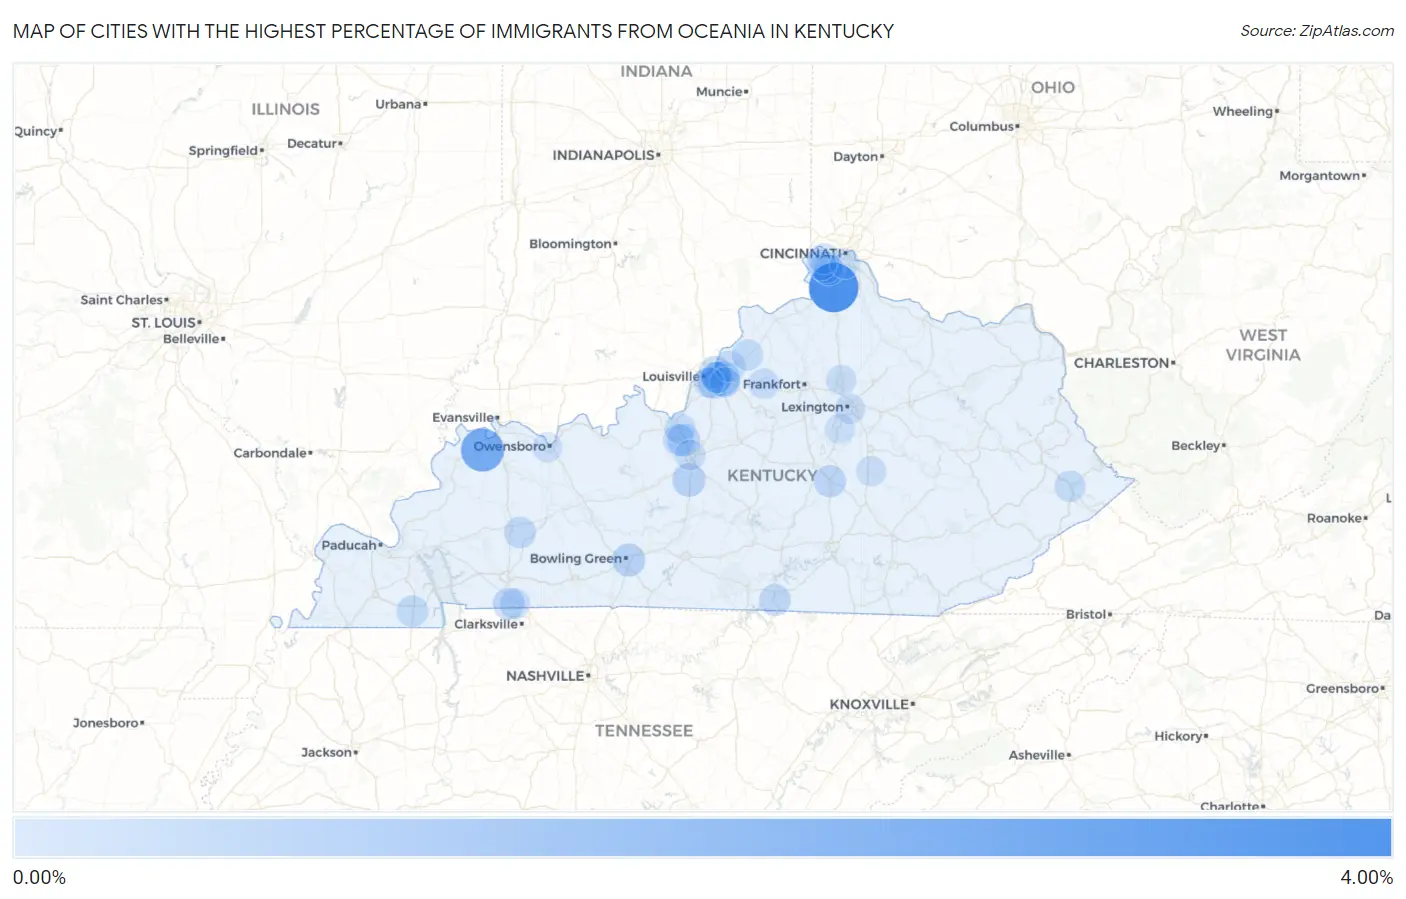
Map of Cities with the Highest Percentage of Immigrants from Oceania in Kentucky
0.00%
4.00%
Cities with the Highest Percentage of Immigrants from Oceania in Kentucky
| City | Oceania | vs State | vs National | |
| 1. | Walton | 3.70% | 0.034%(+3.66)#-1 | 0.089%(+3.61)#0 |
| 2. | Corydon | 2.45% | 0.034%(+2.42)#0 | 0.089%(+2.37)#1 |
| 3. | Hurstbourne | 0.88% | 0.034%(+0.847)#1 | 0.089%(+0.792)#2 |
| 4. | Sonora | 0.58% | 0.034%(+0.548)#2 | 0.089%(+0.493)#3 |
| 5. | Bowling Green | 0.54% | 0.034%(+0.502)#3 | 0.089%(+0.447)#4 |
| 6. | Radcliff | 0.49% | 0.034%(+0.453)#4 | 0.089%(+0.399)#5 |
| 7. | Wellington | 0.45% | 0.034%(+0.418)#5 | 0.089%(+0.363)#6 |
| 8. | Indian Hills | 0.42% | 0.034%(+0.381)#6 | 0.089%(+0.326)#7 |
| 9. | Fort Campbell North | 0.36% | 0.034%(+0.324)#7 | 0.089%(+0.269)#8 |
| 10. | Stanford | 0.36% | 0.034%(+0.322)#8 | 0.089%(+0.267)#9 |
| 11. | Albany | 0.31% | 0.034%(+0.275)#9 | 0.089%(+0.221)#10 |
| 12. | St Matthews | 0.31% | 0.034%(+0.275)#10 | 0.089%(+0.220)#148 |
| 13. | White Plains | 0.30% | 0.034%(+0.263)#11 | 0.089%(+0.209)#149 |
| 14. | Vine Grove | 0.27% | 0.034%(+0.238)#12 | 0.089%(+0.184)#150 |
| 15. | Murray | 0.25% | 0.034%(+0.219)#13 | 0.089%(+0.164)#151 |
| 16. | Oakbrook | 0.23% | 0.034%(+0.195)#14 | 0.089%(+0.140)#152 |
| 17. | Norbourne Estates | 0.22% | 0.034%(+0.182)#15 | 0.089%(+0.127)#153 |
| 18. | Pikeville | 0.21% | 0.034%(+0.178)#16 | 0.089%(+0.123)#154 |
| 19. | Orchard Grass Hills | 0.21% | 0.034%(+0.173)#17 | 0.089%(+0.118)#155 |
| 20. | La Grange | 0.19% | 0.034%(+0.155)#18 | 0.089%(+0.100)#156 |
| 21. | Fort Knox | 0.14% | 0.034%(+0.105)#19 | 0.089%(+0.050)#157 |
| 22. | Hebron | 0.14% | 0.034%(+0.102)#20 | 0.089%(+0.048)#158 |
| 23. | Oak Grove | 0.11% | 0.034%(+0.080)#21 | 0.089%(+0.025)#159 |
| 24. | Florence | 0.11% | 0.034%(+0.075)#22 | 0.089%(+0.021)#160 |
| 25. | Elizabethtown | 0.11% | 0.034%(+0.074)#23 | 0.089%(+0.020)#161 |
| 26. | Shelbyville | 0.099% | 0.034%(+0.065)#24 | 0.089%(+0.010)#162 |
| 27. | Jeffersontown | 0.066% | 0.034%(+0.032)#25 | 0.089%(-0.023)#163 |
| 28. | Burlington | 0.060% | 0.034%(+0.026)#26 | 0.089%(-0.028)#164 |
| 29. | Georgetown | 0.048% | 0.034%(+0.014)#27 | 0.089%(-0.041)#165 |
| 30. | Lexington | 0.033% | 0.034%(-0.001)#28 | 0.089%(-0.056)#246 |
| 31. | Berea | 0.026% | 0.034%(-0.008)#29 | 0.089%(-0.063)#247 |
| 32. | Nicholasville | 0.019% | 0.034%(-0.015)#30 | 0.089%(-0.069)#248 |
| 33. | Covington | 0.015% | 0.034%(-0.019)#31 | 0.089%(-0.074)#249 |
| 34. | Louisville | 0.013% | 0.034%(-0.021)#32 | 0.089%(-0.076)#252 |
| 35. | Owensboro | 0.0033% | 0.034%(-0.031)#33 | 0.089%(-0.085)#253 |
Common Questions
What are the Top 10 Cities with the Highest Percentage of Immigrants from Oceania in Kentucky?
Top 10 Cities with the Highest Percentage of Immigrants from Oceania in Kentucky are:
#1
3.70%
#2
2.45%
#3
0.88%
#4
0.58%
#5
0.54%
#6
0.49%
#7
0.45%
#8
0.42%
#9
0.36%
#10
0.36%
What city has the Highest Percentage of Immigrants from Oceania in Kentucky?
Walton has the Highest Percentage of Immigrants from Oceania in Kentucky with 3.70%.
What is the Percentage of Immigrants from Oceania in the State of Kentucky?
Percentage of Immigrants from Oceania in Kentucky is 0.034%.
What is the Percentage of Immigrants from Oceania in the United States?
Percentage of Immigrants from Oceania in the United States is 0.089%.