Cities with the Highest Percentage of Immigrants from Oceania in Connecticut
RELATED REPORTS & OPTIONS
Oceania
Connecticut
Compare Cities
Map of Cities with the Highest Percentage of Immigrants from Oceania in Connecticut
0.00%
2.50%
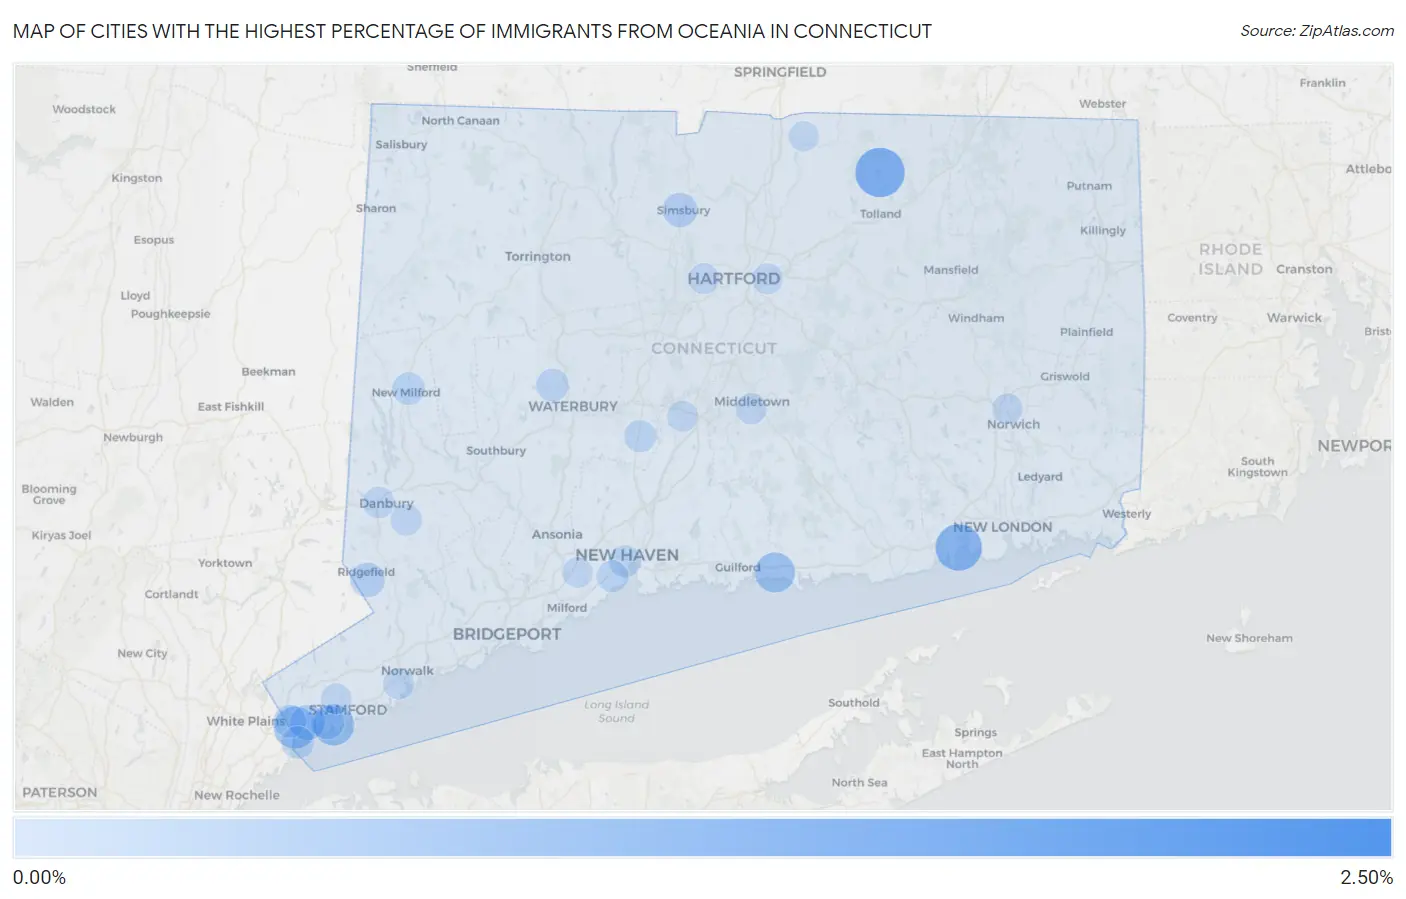
Cities with the Highest Percentage of Immigrants from Oceania in Connecticut
| City | Oceania | vs State | vs National | |
| 1. | Bridgewater | 2.11% | 0.044%(+2.07)#-1 | 0.089%(+2.02)#0 |
| 2. | Crystal Lake | 1.15% | 0.044%(+1.11)#0 | 0.089%(+1.07)#1 |
| 3. | Niantic | 0.97% | 0.044%(+0.928)#1 | 0.089%(+0.884)#2 |
| 4. | Tokeneke | 0.74% | 0.044%(+0.694)#2 | 0.089%(+0.649)#3 |
| 5. | Pemberwick | 0.72% | 0.044%(+0.672)#3 | 0.089%(+0.627)#4 |
| 6. | Old Greenwich | 0.65% | 0.044%(+0.607)#4 | 0.089%(+0.563)#5 |
| 7. | Madison Center | 0.59% | 0.044%(+0.542)#5 | 0.089%(+0.497)#6 |
| 8. | Westport | 0.41% | 0.044%(+0.368)#6 | 0.089%(+0.324)#7 |
| 9. | Mill Plain | 0.38% | 0.044%(+0.336)#7 | 0.089%(+0.292)#8 |
| 10. | Ridgebury | 0.37% | 0.044%(+0.322)#8 | 0.089%(+0.277)#9 |
| 11. | Greenwich | 0.30% | 0.044%(+0.255)#9 | 0.089%(+0.210)#10 |
| 12. | Simsbury Center | 0.26% | 0.044%(+0.218)#10 | 0.089%(+0.173)#11 |
| 13. | Ridgefield | 0.26% | 0.044%(+0.217)#11 | 0.089%(+0.173)#12 |
| 14. | Riverside | 0.22% | 0.044%(+0.176)#12 | 0.089%(+0.131)#13 |
| 15. | Groton Long Point Borough | 0.19% | 0.044%(+0.149)#13 | 0.089%(+0.105)#14 |
| 16. | Compo | 0.16% | 0.044%(+0.121)#14 | 0.089%(+0.076)#15 |
| 17. | Glenville | 0.16% | 0.044%(+0.117)#15 | 0.089%(+0.072)#16 |
| 18. | New Milford | 0.16% | 0.044%(+0.111)#16 | 0.089%(+0.066)#17 |
| 19. | Byram | 0.15% | 0.044%(+0.107)#17 | 0.089%(+0.063)#18 |
| 20. | Oakville | 0.15% | 0.044%(+0.105)#18 | 0.089%(+0.061)#19 |
| 21. | New Haven | 0.12% | 0.044%(+0.078)#19 | 0.089%(+0.034)#215 |
| 22. | Cheshire Village | 0.12% | 0.044%(+0.075)#20 | 0.089%(+0.030)#216 |
| 23. | West Haven | 0.096% | 0.044%(+0.052)#21 | 0.089%(+0.007)#217 |
| 24. | Danbury | 0.079% | 0.044%(+0.035)#22 | 0.089%(-0.010)#218 |
| 25. | Bethel | 0.069% | 0.044%(+0.025)#23 | 0.089%(-0.019)#219 |
| 26. | Norwalk | 0.069% | 0.044%(+0.025)#24 | 0.089%(-0.019)#220 |
| 27. | Middletown | 0.054% | 0.044%(+0.010)#25 | 0.089%(-0.035)#221 |
| 28. | East Hartford | 0.045% | 0.044%(+0.001)#26 | 0.089%(-0.043)#222 |
| 29. | Meriden | 0.041% | 0.044%(-0.003)#27 | 0.089%(-0.047)#223 |
| 30. | West Hartford | 0.041% | 0.044%(-0.004)#28 | 0.089%(-0.048)#224 |
| 31. | Stamford | 0.032% | 0.044%(-0.012)#29 | 0.089%(-0.057)#225 |
| 32. | Orange | 0.028% | 0.044%(-0.016)#30 | 0.089%(-0.061)#226 |
| 33. | Norwich | 0.027% | 0.044%(-0.017)#31 | 0.089%(-0.061)#227 |
| 34. | Hazardville | 0.016% | 0.044%(-0.028)#32 | 0.089%(-0.072)#228 |
1
2Common Questions
What are the Top 10 Cities with the Highest Percentage of Immigrants from Oceania in Connecticut?
Top 10 Cities with the Highest Percentage of Immigrants from Oceania in Connecticut are:
#1
1.15%
#2
0.97%
#3
0.72%
#4
0.65%
#5
0.59%
#6
0.30%
#7
0.26%
#8
0.26%
#9
0.22%
#10
0.16%
What city has the Highest Percentage of Immigrants from Oceania in Connecticut?
Crystal Lake has the Highest Percentage of Immigrants from Oceania in Connecticut with 1.15%.
What is the Percentage of Immigrants from Oceania in the State of Connecticut?
Percentage of Immigrants from Oceania in Connecticut is 0.044%.
What is the Percentage of Immigrants from Oceania in the United States?
Percentage of Immigrants from Oceania in the United States is 0.089%.