Cities with the Highest Percentage of Immigrants from Oceania in Ohio
RELATED REPORTS & OPTIONS
Oceania
Ohio
Compare Cities
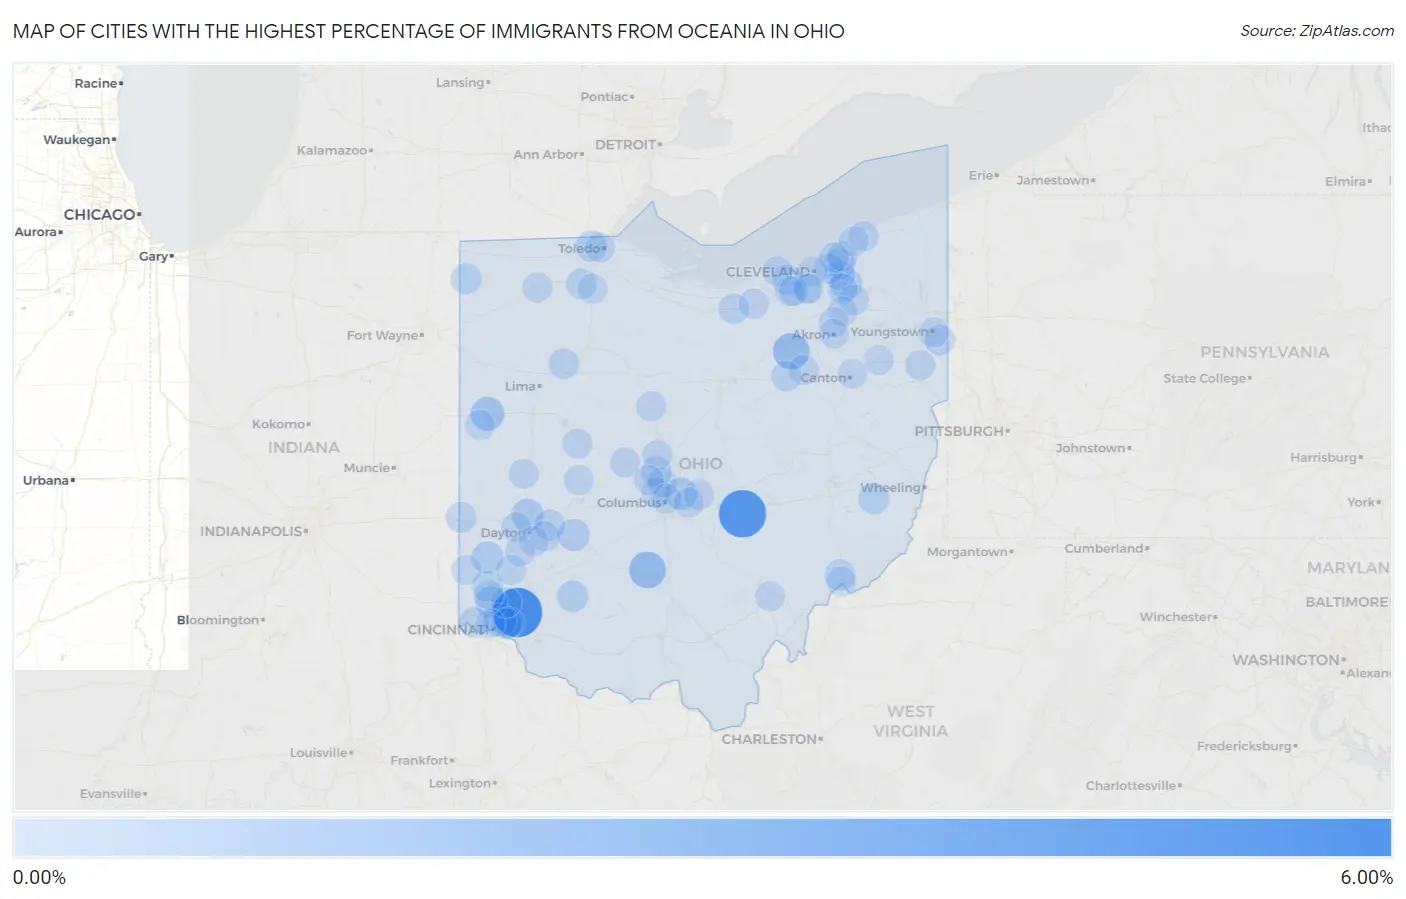
Map of Cities with the Highest Percentage of Immigrants from Oceania in Ohio
0.00%
6.00%
Cities with the Highest Percentage of Immigrants from Oceania in Ohio
| City | Oceania | vs State | vs National | |
| 1. | Miamiville | 5.81% | 0.030%(+5.78)#-1 | 0.089%(+5.72)#0 |
| 2. | Glenford | 5.17% | 0.030%(+5.14)#0 | 0.089%(+5.08)#1 |
| 3. | Clarksburg | 1.95% | 0.030%(+1.92)#1 | 0.089%(+1.86)#2 |
| 4. | Creston | 1.88% | 0.030%(+1.85)#2 | 0.089%(+1.79)#3 |
| 5. | Celina | 1.13% | 0.030%(+1.10)#3 | 0.089%(+1.04)#4 |
| 6. | Norwood | 0.79% | 0.030%(+0.764)#4 | 0.089%(+0.705)#5 |
| 7. | Vandalia | 0.74% | 0.030%(+0.710)#5 | 0.089%(+0.651)#6 |
| 8. | Bentleyville | 0.72% | 0.030%(+0.686)#6 | 0.089%(+0.627)#7 |
| 9. | West Elkton | 0.66% | 0.030%(+0.633)#7 | 0.089%(+0.574)#8 |
| 10. | Gahanna | 0.66% | 0.030%(+0.626)#8 | 0.089%(+0.567)#9 |
| 11. | Cedarville | 0.61% | 0.030%(+0.583)#9 | 0.089%(+0.524)#10 |
| 12. | Forest Park | 0.60% | 0.030%(+0.575)#11 | 0.089%(+0.516)#122 |
| 13. | Martinsville | 0.44% | 0.030%(+0.409)#12 | 0.089%(+0.350)#123 |
| 14. | Ottawa Hills | 0.42% | 0.030%(+0.389)#13 | 0.089%(+0.330)#124 |
| 15. | Highland Heights | 0.37% | 0.030%(+0.340)#14 | 0.089%(+0.281)#125 |
| 16. | Hamilton | 0.36% | 0.030%(+0.335)#15 | 0.089%(+0.276)#126 |
| 17. | Barnesville | 0.35% | 0.030%(+0.321)#16 | 0.089%(+0.261)#127 |
| 18. | Edgerton | 0.35% | 0.030%(+0.319)#17 | 0.089%(+0.260)#128 |
| 19. | Devola | 0.34% | 0.030%(+0.308)#18 | 0.089%(+0.249)#129 |
| 20. | Fairborn | 0.29% | 0.030%(+0.260)#19 | 0.089%(+0.201)#130 |
| 21. | New Paris | 0.28% | 0.030%(+0.248)#20 | 0.089%(+0.189)#131 |
| 22. | Bluffton | 0.25% | 0.030%(+0.225)#21 | 0.089%(+0.166)#132 |
| 23. | Tontogany | 0.25% | 0.030%(+0.222)#22 | 0.089%(+0.163)#133 |
| 24. | Mack | 0.22% | 0.030%(+0.191)#23 | 0.089%(+0.132)#134 |
| 25. | Struthers | 0.21% | 0.030%(+0.179)#24 | 0.089%(+0.120)#135 |
| 26. | Westlake | 0.19% | 0.030%(+0.159)#25 | 0.089%(+0.099)#136 |
| 27. | Fairfax | 0.18% | 0.030%(+0.151)#26 | 0.089%(+0.092)#137 |
| 28. | Mariemont | 0.17% | 0.030%(+0.142)#27 | 0.089%(+0.083)#138 |
| 29. | Wakeman | 0.17% | 0.030%(+0.142)#28 | 0.089%(+0.082)#139 |
| 30. | Powell | 0.16% | 0.030%(+0.133)#29 | 0.089%(+0.074)#140 |
| 31. | Sharonville | 0.15% | 0.030%(+0.120)#30 | 0.089%(+0.061)#141 |
| 32. | Pepper Pike | 0.13% | 0.030%(+0.103)#31 | 0.089%(+0.044)#142 |
| 33. | Orrville | 0.13% | 0.030%(+0.103)#32 | 0.089%(+0.044)#143 |
| 34. | Aurora | 0.13% | 0.030%(+0.098)#33 | 0.089%(+0.039)#144 |
| 35. | Cleveland Heights | 0.13% | 0.030%(+0.097)#34 | 0.089%(+0.038)#145 |
| 36. | Oberlin | 0.12% | 0.030%(+0.092)#35 | 0.089%(+0.033)#146 |
| 37. | Bellefontaine | 0.12% | 0.030%(+0.087)#36 | 0.089%(+0.027)#147 |
| 38. | Wooster | 0.11% | 0.030%(+0.081)#37 | 0.089%(+0.022)#148 |
| 39. | Marysville | 0.10% | 0.030%(+0.075)#38 | 0.089%(+0.016)#149 |
| 40. | Piqua | 0.10% | 0.030%(+0.073)#39 | 0.089%(+0.014)#150 |
| 41. | Napoleon | 0.10% | 0.030%(+0.072)#40 | 0.089%(+0.013)#151 |
| 42. | Leetonia | 0.096% | 0.030%(+0.067)#41 | 0.089%(+0.008)#152 |
| 43. | Pataskala | 0.095% | 0.030%(+0.066)#42 | 0.089%(+0.007)#153 |
| 44. | Willoughby Hills | 0.090% | 0.030%(+0.061)#43 | 0.089%(+0.002)#154 |
| 45. | Beavercreek | 0.086% | 0.030%(+0.056)#44 | 0.089%(-0.003)#155 |
| 46. | Upper Arlington | 0.082% | 0.030%(+0.053)#45 | 0.089%(-0.006)#156 |
| 47. | Painesville | 0.078% | 0.030%(+0.049)#46 | 0.089%(-0.010)#157 |
| 48. | Delaware | 0.076% | 0.030%(+0.047)#47 | 0.089%(-0.012)#158 |
| 49. | Avon Lake | 0.071% | 0.030%(+0.042)#48 | 0.089%(-0.017)#159 |
| 50. | Alliance | 0.069% | 0.030%(+0.040)#49 | 0.089%(-0.019)#160 |
| 51. | Olmsted Falls | 0.069% | 0.030%(+0.040)#50 | 0.089%(-0.019)#161 |
| 52. | Worthington | 0.067% | 0.030%(+0.037)#51 | 0.089%(-0.022)#162 |
| 53. | Solon | 0.067% | 0.030%(+0.037)#52 | 0.089%(-0.022)#163 |
| 54. | Coldwater | 0.067% | 0.030%(+0.037)#53 | 0.089%(-0.022)#164 |
| 55. | Parma Heights | 0.063% | 0.030%(+0.033)#54 | 0.089%(-0.026)#165 |
| 56. | Urbana | 0.063% | 0.030%(+0.033)#55 | 0.089%(-0.026)#166 |
| 57. | Trotwood | 0.056% | 0.030%(+0.027)#56 | 0.089%(-0.032)#167 |
| 58. | Middletown | 0.051% | 0.030%(+0.022)#57 | 0.089%(-0.037)#168 |
| 59. | Dublin | 0.051% | 0.030%(+0.022)#58 | 0.089%(-0.037)#169 |
| 60. | Miamisburg | 0.050% | 0.030%(+0.021)#59 | 0.089%(-0.038)#170 |
| 61. | Youngstown | 0.050% | 0.030%(+0.020)#60 | 0.089%(-0.039)#171 |
| 62. | Cuyahoga Falls | 0.047% | 0.030%(+0.018)#61 | 0.089%(-0.041)#172 |
| 63. | Columbus | 0.047% | 0.030%(+0.017)#62 | 0.089%(-0.042)#238 |
| 64. | Marietta | 0.045% | 0.030%(+0.015)#63 | 0.089%(-0.044)#239 |
| 65. | Fairfield | 0.045% | 0.030%(+0.015)#64 | 0.089%(-0.044)#240 |
| 66. | Athens | 0.044% | 0.030%(+0.015)#65 | 0.089%(-0.045)#241 |
| 67. | Bowling Green | 0.043% | 0.030%(+0.014)#66 | 0.089%(-0.046)#242 |
| 68. | Oxford | 0.036% | 0.030%(+0.007)#67 | 0.089%(-0.052)#243 |
| 69. | Berea | 0.032% | 0.030%(+0.003)#68 | 0.089%(-0.056)#244 |
| 70. | Kettering | 0.031% | 0.030%(+0.002)#69 | 0.089%(-0.057)#245 |
| 71. | Cincinnati | 0.030% | 0.030%(+0.001)#70 | 0.089%(-0.058)#246 |
| 72. | Hudson | 0.030% | 0.030%(+0.001)#71 | 0.089%(-0.058)#247 |
| 73. | Mentor | 0.025% | 0.030%(-0.004)#72 | 0.089%(-0.063)#248 |
| 74. | Reynoldsburg | 0.024% | 0.030%(-0.005)#73 | 0.089%(-0.064)#249 |
| 75. | Marion | 0.019% | 0.030%(-0.010)#74 | 0.089%(-0.069)#250 |
| 76. | Toledo | 0.017% | 0.030%(-0.013)#75 | 0.089%(-0.072)#341 |
| 77. | Canton | 0.016% | 0.030%(-0.014)#76 | 0.089%(-0.073)#342 |
| 78. | Euclid | 0.014% | 0.030%(-0.015)#77 | 0.089%(-0.074)#343 |
| 79. | Cleveland | 0.011% | 0.030%(-0.019)#78 | 0.089%(-0.078)#344 |
| 80. | Akron | 0.0084% | 0.030%(-0.021)#79 | 0.089%(-0.080)#345 |
| 81. | Parma | 0.0050% | 0.030%(-0.025)#80 | 0.089%(-0.084)#346 |
Common Questions
What are the Top 10 Cities with the Highest Percentage of Immigrants from Oceania in Ohio?
Top 10 Cities with the Highest Percentage of Immigrants from Oceania in Ohio are:
#1
5.81%
#2
5.17%
#3
1.95%
#4
1.88%
#5
1.13%
#6
0.79%
#7
0.74%
#8
0.72%
#9
0.66%
#10
0.66%
What city has the Highest Percentage of Immigrants from Oceania in Ohio?
Miamiville has the Highest Percentage of Immigrants from Oceania in Ohio with 5.81%.
What is the Percentage of Immigrants from Oceania in the State of Ohio?
Percentage of Immigrants from Oceania in Ohio is 0.030%.
What is the Percentage of Immigrants from Oceania in the United States?
Percentage of Immigrants from Oceania in the United States is 0.089%.