Cities with the Highest Percentage of Immigrants from Oceania in New Mexico
RELATED REPORTS & OPTIONS
Oceania
New Mexico
Compare Cities
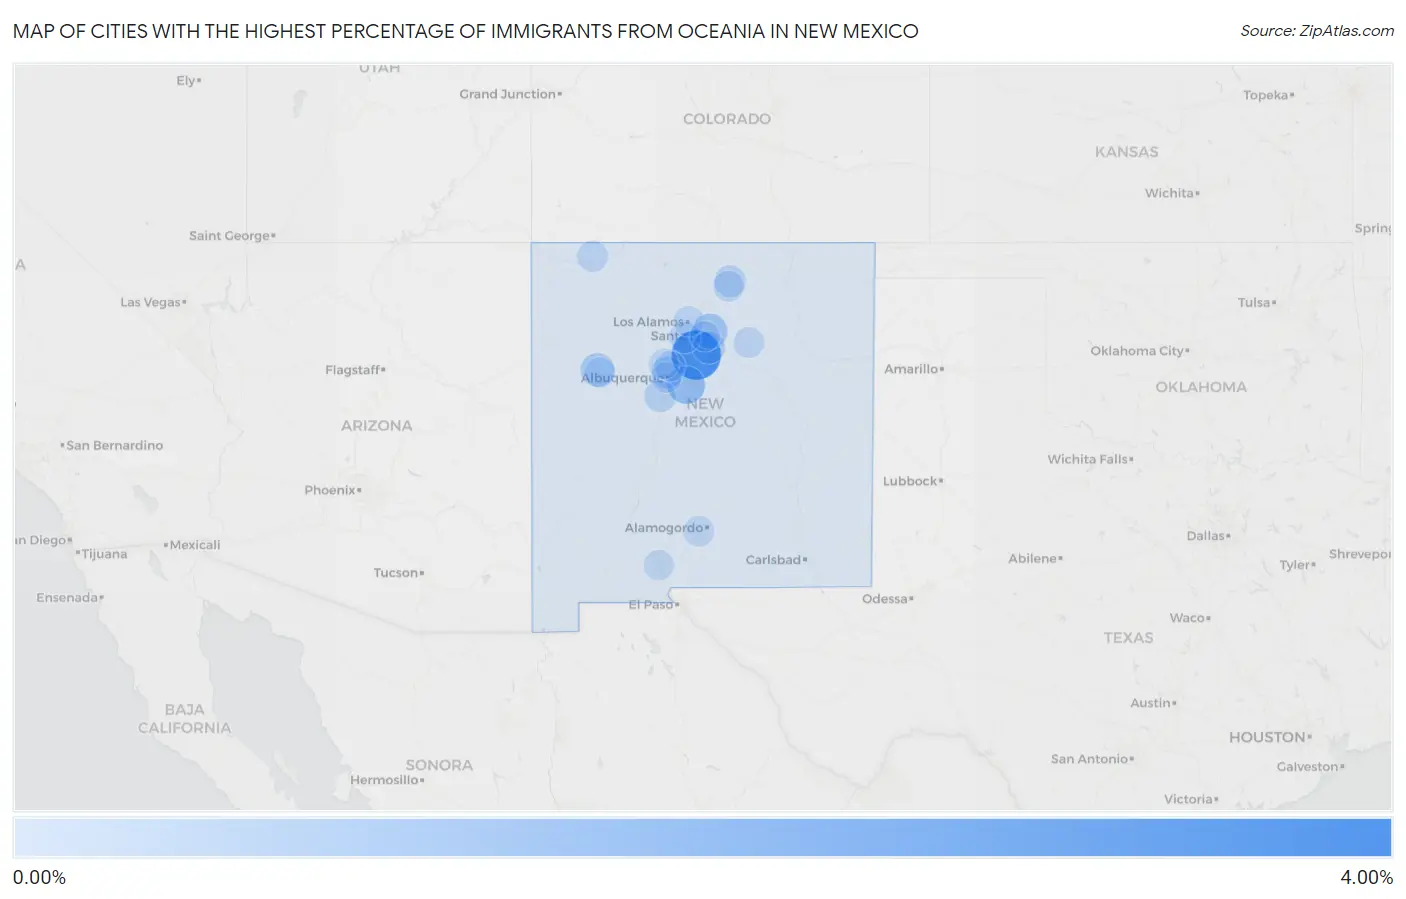
Map of Cities with the Highest Percentage of Immigrants from Oceania in New Mexico
0.00%
4.00%
Cities with the Highest Percentage of Immigrants from Oceania in New Mexico
| City | Oceania | vs State | vs National | |
| 1. | Madrid | 3.14% | 0.036%(+3.10)#-1 | 0.089%(+3.05)#0 |
| 2. | Ponderosa Pine | 1.20% | 0.036%(+1.17)#0 | 0.089%(+1.12)#1 |
| 3. | Tesuque | 0.80% | 0.036%(+0.765)#1 | 0.089%(+0.713)#2 |
| 4. | Las Campanas | 0.72% | 0.036%(+0.687)#2 | 0.089%(+0.635)#3 |
| 5. | Milan | 0.59% | 0.036%(+0.553)#3 | 0.089%(+0.501)#4 |
| 6. | Kirtland Afb | 0.50% | 0.036%(+0.459)#4 | 0.089%(+0.407)#5 |
| 7. | Eldorado At Santa Fe | 0.35% | 0.036%(+0.311)#5 | 0.089%(+0.259)#6 |
| 8. | Los Ranchos De Albuquerque | 0.29% | 0.036%(+0.252)#6 | 0.089%(+0.200)#7 |
| 9. | Taos Pueblo | 0.28% | 0.036%(+0.245)#7 | 0.089%(+0.193)#8 |
| 10. | Placitas Cdp Sandoval County | 0.27% | 0.036%(+0.234)#8 | 0.089%(+0.182)#40 |
| 11. | Los Lunas | 0.25% | 0.036%(+0.210)#9 | 0.089%(+0.158)#41 |
| 12. | Cochiti Lake | 0.21% | 0.036%(+0.178)#10 | 0.089%(+0.126)#42 |
| 13. | Aztec | 0.18% | 0.036%(+0.141)#11 | 0.089%(+0.088)#43 |
| 14. | Taos | 0.12% | 0.036%(+0.088)#12 | 0.089%(+0.035)#44 |
| 15. | Las Vegas | 0.12% | 0.036%(+0.085)#13 | 0.089%(+0.033)#45 |
| 16. | Los Alamos | 0.074% | 0.036%(+0.038)#14 | 0.089%(-0.014)#46 |
| 17. | Holloman Afb | 0.072% | 0.036%(+0.035)#15 | 0.089%(-0.017)#47 |
| 18. | Grants | 0.065% | 0.036%(+0.029)#16 | 0.089%(-0.023)#48 |
| 19. | Albuquerque | 0.062% | 0.036%(+0.026)#17 | 0.089%(-0.027)#49 |
| 20. | Corrales | 0.059% | 0.036%(+0.023)#18 | 0.089%(-0.030)#50 |
| 21. | Las Cruces | 0.039% | 0.036%(+0.002)#19 | 0.089%(-0.050)#287 |
| 22. | Rio Rancho | 0.037% | 0.036%(+0.001)#20 | 0.089%(-0.051)#288 |
| 23. | Espanola | 0.029% | 0.036%(-0.008)#21 | 0.089%(-0.060)#289 |
| 24. | Santa Fe | 0.026% | 0.036%(-0.010)#22 | 0.089%(-0.062)#290 |
Common Questions
What are the Top 10 Cities with the Highest Percentage of Immigrants from Oceania in New Mexico?
Top 10 Cities with the Highest Percentage of Immigrants from Oceania in New Mexico are:
#1
3.14%
#2
1.20%
#3
0.80%
#4
0.59%
#5
0.35%
#6
0.29%
#7
0.28%
#8
0.25%
#9
0.21%
#10
0.18%
What city has the Highest Percentage of Immigrants from Oceania in New Mexico?
Madrid has the Highest Percentage of Immigrants from Oceania in New Mexico with 3.14%.
What is the Percentage of Immigrants from Oceania in the State of New Mexico?
Percentage of Immigrants from Oceania in New Mexico is 0.036%.
What is the Percentage of Immigrants from Oceania in the United States?
Percentage of Immigrants from Oceania in the United States is 0.089%.