Cities with the Highest Percentage of Households With One or more Vehicles in Mississippi
RELATED REPORTS & OPTIONS
Households with 1 or more Cars
Mississippi
Compare Cities
Map of Cities with the Highest Percentage of Households With One or more Vehicles in Mississippi
0.0%
100.0%
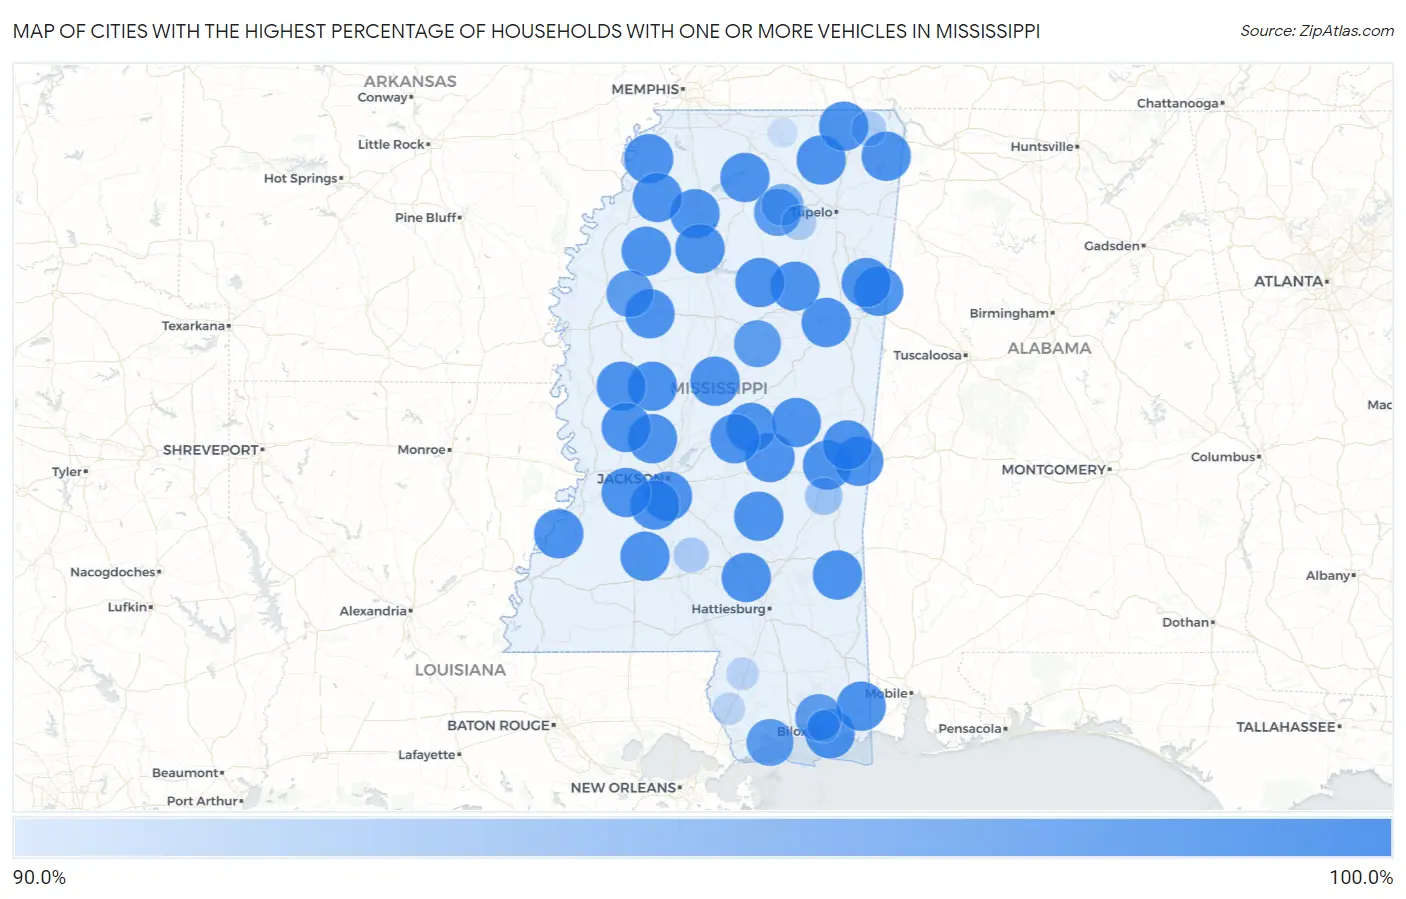
Cities with the Highest Percentage of Households With One or more Vehicles in Mississippi
| City | Housholds With 1+ Cars | vs State | vs National | |
| 1. | Gluckstadt | 100.0% | 93.9% (+6.10)#1 | 91.7% (+8.30)#31 |
| 2. | Dumas | 100.0% | 93.9% (+6.10)#2 | 91.7% (+8.30)#337 |
| 3. | Grace | 100.0% | 93.9% (+6.10)#3 | 91.7% (+8.30)#429 |
| 4. | Eden | 100.0% | 93.9% (+6.10)#4 | 91.7% (+8.30)#447 |
| 5. | Sylvarena | 100.0% | 93.9% (+6.10)#5 | 91.7% (+8.30)#626 |
| 6. | Gulf Park Estates | 100.0% | 93.9% (+6.10)#6 | 91.7% (+8.30)#769 |
| 7. | Mississippi State | 100.0% | 93.9% (+6.10)#7 | 91.7% (+8.30)#849 |
| 8. | Cleary | 100.0% | 93.9% (+6.10)#8 | 91.7% (+8.30)#1,088 |
| 9. | Terry | 100.0% | 93.9% (+6.10)#9 | 91.7% (+8.30)#1,227 |
| 10. | Nellieburg | 100.0% | 93.9% (+6.10)#10 | 91.7% (+8.30)#1,343 |
| 11. | Conehatta | 100.0% | 93.9% (+6.10)#11 | 91.7% (+8.30)#1,397 |
| 12. | Caledonia | 100.0% | 93.9% (+6.10)#12 | 91.7% (+8.30)#1,424 |
| 13. | Alcorn State University | 100.0% | 93.9% (+6.10)#13 | 91.7% (+8.30)#1,497 |
| 14. | Courtland | 100.0% | 93.9% (+6.10)#14 | 91.7% (+8.30)#1,595 |
| 15. | Mississippi Valley State University | 100.0% | 93.9% (+6.10)#15 | 91.7% (+8.30)#1,625 |
| 16. | Big Point | 100.0% | 93.9% (+6.10)#16 | 91.7% (+8.30)#1,643 |
| 17. | Kearney Park | 100.0% | 93.9% (+6.10)#17 | 91.7% (+8.30)#1,706 |
| 18. | Toomsuba | 100.0% | 93.9% (+6.10)#18 | 91.7% (+8.30)#1,865 |
| 19. | New Hamilton | 100.0% | 93.9% (+6.10)#19 | 91.7% (+8.30)#1,888 |
| 20. | Clara | 100.0% | 93.9% (+6.10)#20 | 91.7% (+8.30)#2,102 |
| 21. | Standing Pine | 100.0% | 93.9% (+6.10)#21 | 91.7% (+8.30)#2,153 |
| 22. | Meridian Station | 100.0% | 93.9% (+6.10)#22 | 91.7% (+8.30)#2,193 |
| 23. | White Oak | 100.0% | 93.9% (+6.10)#23 | 91.7% (+8.30)#2,206 |
| 24. | Agricola | 100.0% | 93.9% (+6.10)#24 | 91.7% (+8.30)#2,304 |
| 25. | Beauregard | 100.0% | 93.9% (+6.10)#25 | 91.7% (+8.30)#2,325 |
| 26. | Eudora | 100.0% | 93.9% (+6.10)#26 | 91.7% (+8.30)#2,384 |
| 27. | Mantee | 100.0% | 93.9% (+6.10)#27 | 91.7% (+8.30)#2,429 |
| 28. | Mount Pleasant | 100.0% | 93.9% (+6.10)#28 | 91.7% (+8.30)#2,599 |
| 29. | Abbeville | 100.0% | 93.9% (+6.10)#29 | 91.7% (+8.30)#2,681 |
| 30. | Lakeview | 100.0% | 93.9% (+6.10)#30 | 91.7% (+8.30)#2,685 |
| 31. | Paris | 100.0% | 93.9% (+6.10)#31 | 91.7% (+8.30)#2,755 |
| 32. | Tucker | 100.0% | 93.9% (+6.10)#32 | 91.7% (+8.30)#2,763 |
| 33. | Runnelstown | 100.0% | 93.9% (+6.10)#33 | 91.7% (+8.30)#2,793 |
| 34. | Sumner | 100.0% | 93.9% (+6.10)#34 | 91.7% (+8.30)#2,800 |
| 35. | Seminary | 100.0% | 93.9% (+6.10)#35 | 91.7% (+8.30)#2,869 |
| 36. | Kirkville | 100.0% | 93.9% (+6.10)#36 | 91.7% (+8.30)#2,904 |
| 37. | Kokomo | 100.0% | 93.9% (+6.10)#37 | 91.7% (+8.30)#2,913 |
| 38. | Harperville | 100.0% | 93.9% (+6.10)#38 | 91.7% (+8.30)#2,928 |
| 39. | Arkabutla | 100.0% | 93.9% (+6.10)#39 | 91.7% (+8.30)#2,978 |
| 40. | Benton | 100.0% | 93.9% (+6.10)#40 | 91.7% (+8.30)#3,065 |
| 41. | Bogue Chitto | 100.0% | 93.9% (+6.10)#41 | 91.7% (+8.30)#3,126 |
| 42. | Bovina | 100.0% | 93.9% (+6.10)#42 | 91.7% (+8.30)#3,260 |
| 43. | De Soto | 100.0% | 93.9% (+6.10)#43 | 91.7% (+8.30)#3,280 |
| 44. | Skene | 100.0% | 93.9% (+6.10)#44 | 91.7% (+8.30)#3,393 |
| 45. | Glen Allan | 100.0% | 93.9% (+6.10)#45 | 91.7% (+8.30)#3,558 |
| 46. | Bethlehem | 100.0% | 93.9% (+6.10)#46 | 91.7% (+8.30)#3,620 |
| 47. | Rena Lara | 100.0% | 93.9% (+6.10)#47 | 91.7% (+8.30)#3,702 |
| 48. | Longview | 100.0% | 93.9% (+6.10)#48 | 91.7% (+8.30)#3,717 |
| 49. | Eagle Bend | 100.0% | 93.9% (+6.10)#49 | 91.7% (+8.30)#3,821 |
| 50. | Sallis | 100.0% | 93.9% (+6.10)#50 | 91.7% (+8.30)#4,067 |
| 51. | New Site | 100.0% | 93.9% (+6.10)#51 | 91.7% (+8.30)#4,252 |
| 52. | Darling | 100.0% | 93.9% (+6.10)#52 | 91.7% (+8.30)#4,288 |
| 53. | Eastabuchie | 100.0% | 93.9% (+6.10)#53 | 91.7% (+8.30)#4,401 |
| 54. | Kossuth | 100.0% | 93.9% (+6.10)#54 | 91.7% (+8.30)#4,455 |
| 55. | Louise | 100.0% | 93.9% (+6.10)#55 | 91.7% (+8.30)#4,543 |
| 56. | Independence | 100.0% | 93.9% (+6.10)#56 | 91.7% (+8.30)#4,635 |
| 57. | Biggersville | 100.0% | 93.9% (+6.10)#57 | 91.7% (+8.30)#4,679 |
| 58. | Fernwood | 100.0% | 93.9% (+6.10)#58 | 91.7% (+8.30)#4,793 |
| 59. | Valley Park | 100.0% | 93.9% (+6.10)#59 | 91.7% (+8.30)#4,810 |
| 60. | Lena | 100.0% | 93.9% (+6.10)#60 | 91.7% (+8.30)#4,950 |
| 61. | Bobo | 100.0% | 93.9% (+6.10)#61 | 91.7% (+8.30)#5,002 |
| 62. | Ovett | 100.0% | 93.9% (+6.10)#62 | 91.7% (+8.30)#5,014 |
| 63. | Pattison | 100.0% | 93.9% (+6.10)#63 | 91.7% (+8.30)#5,118 |
| 64. | Paden | 100.0% | 93.9% (+6.10)#64 | 91.7% (+8.30)#5,137 |
| 65. | Strayhorn | 100.0% | 93.9% (+6.10)#66 | 91.7% (+8.30)#5,179 |
| 66. | Tula | 100.0% | 93.9% (+6.10)#67 | 91.7% (+8.30)#5,180 |
| 67. | Redwood | 100.0% | 93.9% (+6.10)#68 | 91.7% (+8.30)#5,612 |
| 68. | Slate Springs | 100.0% | 93.9% (+6.10)#69 | 91.7% (+8.30)#5,626 |
| 69. | Tillatoba | 100.0% | 93.9% (+6.10)#70 | 91.7% (+8.30)#5,918 |
| 70. | Learned | 100.0% | 93.9% (+6.10)#71 | 91.7% (+8.30)#6,049 |
| 71. | Bolivar | 100.0% | 93.9% (+6.10)#72 | 91.7% (+8.30)#6,097 |
| 72. | Dundee | 100.0% | 93.9% (+6.10)#73 | 91.7% (+8.30)#6,180 |
| 73. | Satartia | 100.0% | 93.9% (+6.10)#74 | 91.7% (+8.30)#6,198 |
| 74. | Red Banks | 100.0% | 93.9% (+6.10)#75 | 91.7% (+8.30)#6,266 |
| 75. | Scott | 100.0% | 93.9% (+6.10)#76 | 91.7% (+8.30)#6,308 |
| 76. | Symonds | 100.0% | 93.9% (+6.10)#77 | 91.7% (+8.30)#6,573 |
| 77. | Stoneville | 100.0% | 93.9% (+6.10)#78 | 91.7% (+8.30)#6,639 |
| 78. | Moselle | 100.0% | 93.9% (+6.10)#79 | 91.7% (+8.30)#6,640 |
| 79. | Pheba | 100.0% | 93.9% (+6.10)#80 | 91.7% (+8.30)#6,687 |
| 80. | Van Vleet | 100.0% | 93.9% (+6.10)#81 | 91.7% (+8.30)#6,713 |
| 81. | Dennis | 100.0% | 93.9% (+6.10)#82 | 91.7% (+8.30)#6,714 |
| 82. | Leaf | 100.0% | 93.9% (+6.10)#83 | 91.7% (+8.30)#6,835 |
| 83. | Waterford | 100.0% | 93.9% (+6.10)#84 | 91.7% (+8.30)#6,944 |
| 84. | Jacinto | 100.0% | 93.9% (+6.10)#85 | 91.7% (+8.30)#6,945 |
| 85. | Chalybeate | 100.0% | 93.9% (+6.10)#86 | 91.7% (+8.30)#6,971 |
| 86. | Latimer | 99.9% | 93.9% (+6.00)#87 | 91.7% (+8.20)#7,130 |
| 87. | Wheeler | 99.9% | 93.9% (+6.00)#88 | 91.7% (+8.20)#7,332 |
| 88. | Toccopola | 99.9% | 93.9% (+6.00)#89 | 91.7% (+8.20)#7,449 |
| 89. | French Camp | 99.9% | 93.9% (+6.00)#90 | 91.7% (+8.20)#7,468 |
| 90. | Henderson Point | 99.9% | 93.9% (+6.00)#91 | 91.7% (+8.20)#7,510 |
| 91. | Doddsville | 99.9% | 93.9% (+6.00)#92 | 91.7% (+8.20)#7,524 |
| 92. | Thaxton | 99.7% | 93.9% (+5.80)#93 | 91.7% (+8.00)#7,868 |
| 93. | Enterprise | 99.5% | 93.9% (+5.60)#94 | 91.7% (+7.80)#8,079 |
| 94. | Algoma | 99.4% | 93.9% (+5.50)#95 | 91.7% (+7.70)#8,220 |
| 95. | New Hebron | 99.4% | 93.9% (+5.50)#96 | 91.7% (+7.70)#8,243 |
| 96. | Glen | 99.4% | 93.9% (+5.50)#97 | 91.7% (+7.70)#8,253 |
| 97. | Gulf Hills | 99.3% | 93.9% (+5.40)#98 | 91.7% (+7.60)#8,294 |
| 98. | Poplarville | 99.3% | 93.9% (+5.40)#99 | 91.7% (+7.60)#8,338 |
| 99. | Hide A Way Lake | 99.3% | 93.9% (+5.40)#100 | 91.7% (+7.60)#8,351 |
| 100. | Ashland | 99.2% | 93.9% (+5.30)#101 | 91.7% (+7.50)#8,587 |
Common Questions
What are the Top 10 Cities with the Highest Percentage of Households With One or more Vehicles in Mississippi?
Top 10 Cities with the Highest Percentage of Households With One or more Vehicles in Mississippi are:
#1
100.0%
#2
100.0%
#3
100.0%
#4
100.0%
#5
100.0%
#6
100.0%
#7
100.0%
#8
100.0%
#9
100.0%
#10
100.0%
What city has the Highest Percentage of Households With One or more Vehicles in Mississippi?
Dumas has the Highest Percentage of Households With One or more Vehicles in Mississippi with 100.0%.
What is the Percentage of Households With One or more Vehicles in the State of Mississippi?
Percentage of Households With One or more Vehicles in Mississippi is 93.9%.
What is the Percentage of Households With One or more Vehicles in the United States?
Percentage of Households With One or more Vehicles in the United States is 91.7%.