Cities with the Highest Percentage of Households With One or more Vehicles in Minnesota
RELATED REPORTS & OPTIONS
Households with 1 or more Cars
Minnesota
Compare Cities
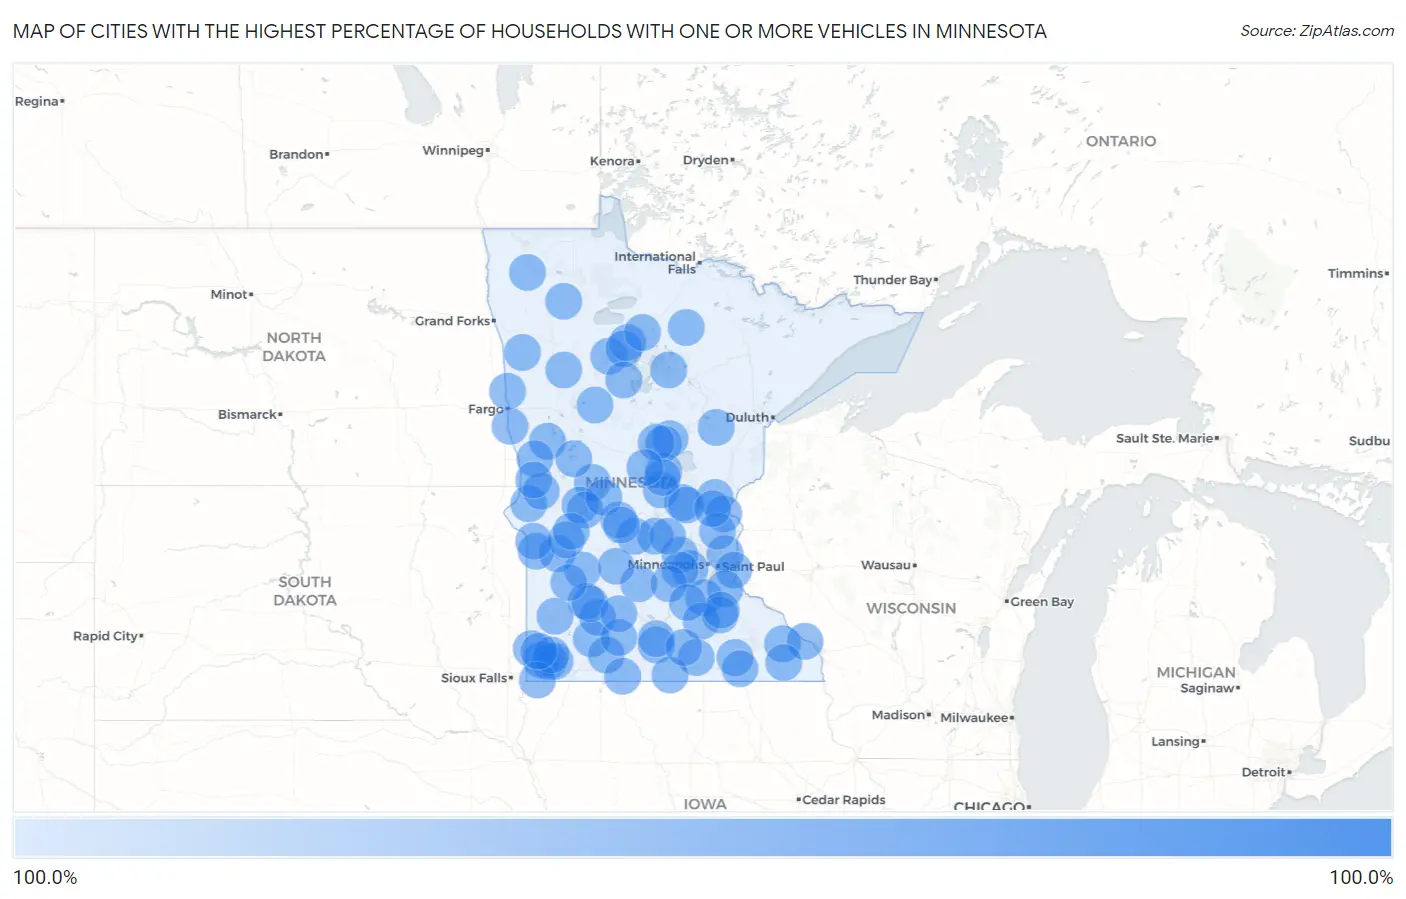
Map of Cities with the Highest Percentage of Households With One or more Vehicles in Minnesota
0.0%
100.0%
Cities with the Highest Percentage of Households With One or more Vehicles in Minnesota
| City | Housholds With 1+ Cars | vs State | vs National | |
| 1. | Tonka Bay | 100.0% | 93.3%(+6.70)#1 | 91.7%(+8.30)#93 |
| 2. | Dellwood | 100.0% | 93.3%(+6.70)#2 | 91.7%(+8.30)#110 |
| 3. | Vernon Center | 100.0% | 93.3%(+6.70)#3 | 91.7%(+8.30)#310 |
| 4. | Maynard | 100.0% | 93.3%(+6.70)#4 | 91.7%(+8.30)#379 |
| 5. | Storden | 100.0% | 93.3%(+6.70)#5 | 91.7%(+8.30)#388 |
| 6. | Wilton | 100.0% | 93.3%(+6.70)#6 | 91.7%(+8.30)#407 |
| 7. | Hardwick | 100.0% | 93.3%(+6.70)#7 | 91.7%(+8.30)#499 |
| 8. | High Forest | 100.0% | 93.3%(+6.70)#8 | 91.7%(+8.30)#551 |
| 9. | Grasston | 100.0% | 93.3%(+6.70)#9 | 91.7%(+8.30)#570 |
| 10. | Goodridge | 100.0% | 93.3%(+6.70)#10 | 91.7%(+8.30)#623 |
| 11. | Wanda | 100.0% | 93.3%(+6.70)#11 | 91.7%(+8.30)#625 |
| 12. | Ihlen | 100.0% | 93.3%(+6.70)#12 | 91.7%(+8.30)#650 |
| 13. | Kenneth | 100.0% | 93.3%(+6.70)#13 | 91.7%(+8.30)#655 |
| 14. | Beaulieu | 100.0% | 93.3%(+6.70)#14 | 91.7%(+8.30)#684 |
| 15. | Fish Lake | 100.0% | 93.3%(+6.70)#15 | 91.7%(+8.30)#691 |
| 16. | Sargeant | 100.0% | 93.3%(+6.70)#16 | 91.7%(+8.30)#696 |
| 17. | Hubbard | 100.0% | 93.3%(+6.70)#17 | 91.7%(+8.30)#725 |
| 18. | Credit River | 100.0% | 93.3%(+6.70)#18 | 91.7%(+8.30)#799 |
| 19. | Elko New Market | 100.0% | 93.3%(+6.70)#19 | 91.7%(+8.30)#816 |
| 20. | Rockford | 100.0% | 93.3%(+6.70)#20 | 91.7%(+8.30)#820 |
| 21. | Afton | 100.0% | 93.3%(+6.70)#21 | 91.7%(+8.30)#946 |
| 22. | St Bonifacius | 100.0% | 93.3%(+6.70)#22 | 91.7%(+8.30)#1,103 |
| 23. | St. John's University | 100.0% | 93.3%(+6.70)#23 | 91.7%(+8.30)#1,181 |
| 24. | Eden Valley | 100.0% | 93.3%(+6.70)#24 | 91.7%(+8.30)#1,541 |
| 25. | Harris | 100.0% | 93.3%(+6.70)#25 | 91.7%(+8.30)#1,634 |
| 26. | Martin Lake | 100.0% | 93.3%(+6.70)#26 | 91.7%(+8.30)#1,679 |
| 27. | Warsaw | 100.0% | 93.3%(+6.70)#27 | 91.7%(+8.30)#1,802 |
| 28. | Foreston | 100.0% | 93.3%(+6.70)#28 | 91.7%(+8.30)#1,918 |
| 29. | Stewart | 100.0% | 93.3%(+6.70)#29 | 91.7%(+8.30)#2,200 |
| 30. | Hamburg | 100.0% | 93.3%(+6.70)#30 | 91.7%(+8.30)#2,285 |
| 31. | Vermillion | 100.0% | 93.3%(+6.70)#31 | 91.7%(+8.30)#2,423 |
| 32. | Crown College | 100.0% | 93.3%(+6.70)#32 | 91.7%(+8.30)#2,536 |
| 33. | Carlos | 100.0% | 93.3%(+6.70)#33 | 91.7%(+8.30)#2,565 |
| 34. | Milan | 100.0% | 93.3%(+6.70)#34 | 91.7%(+8.30)#2,667 |
| 35. | Hartland | 100.0% | 93.3%(+6.70)#35 | 91.7%(+8.30)#2,716 |
| 36. | Marion | 100.0% | 93.3%(+6.70)#36 | 91.7%(+8.30)#2,759 |
| 37. | Vesta | 100.0% | 93.3%(+6.70)#37 | 91.7%(+8.30)#2,997 |
| 38. | Lowry | 100.0% | 93.3%(+6.70)#38 | 91.7%(+8.30)#3,036 |
| 39. | Russell | 100.0% | 93.3%(+6.70)#39 | 91.7%(+8.30)#3,102 |
| 40. | Long Beach | 100.0% | 93.3%(+6.70)#40 | 91.7%(+8.30)#3,124 |
| 41. | Buckman | 100.0% | 93.3%(+6.70)#41 | 91.7%(+8.30)#3,154 |
| 42. | Lismore | 100.0% | 93.3%(+6.70)#42 | 91.7%(+8.30)#3,172 |
| 43. | Frost | 100.0% | 93.3%(+6.70)#43 | 91.7%(+8.30)#3,205 |
| 44. | Fairhaven | 100.0% | 93.3%(+6.70)#44 | 91.7%(+8.30)#3,273 |
| 45. | Dunnell | 100.0% | 93.3%(+6.70)#45 | 91.7%(+8.30)#3,301 |
| 46. | Dresbach | 100.0% | 93.3%(+6.70)#46 | 91.7%(+8.30)#3,371 |
| 47. | Cuyuna | 100.0% | 93.3%(+6.70)#47 | 91.7%(+8.30)#3,475 |
| 48. | Garden City | 100.0% | 93.3%(+6.70)#49 | 91.7%(+8.30)#3,672 |
| 49. | Pease | 100.0% | 93.3%(+6.70)#50 | 91.7%(+8.30)#3,673 |
| 50. | Nerstrand | 100.0% | 93.3%(+6.70)#51 | 91.7%(+8.30)#3,701 |
| 51. | Dennison | 100.0% | 93.3%(+6.70)#52 | 91.7%(+8.30)#3,711 |
| 52. | Heidelberg | 100.0% | 93.3%(+6.70)#53 | 91.7%(+8.30)#3,728 |
| 53. | Osage | 100.0% | 93.3%(+6.70)#54 | 91.7%(+8.30)#3,752 |
| 54. | Lake Lillian | 100.0% | 93.3%(+6.70)#55 | 91.7%(+8.30)#3,838 |
| 55. | Utica | 100.0% | 93.3%(+6.70)#56 | 91.7%(+8.30)#3,961 |
| 56. | Bellingham | 100.0% | 93.3%(+6.70)#57 | 91.7%(+8.30)#4,007 |
| 57. | Tenstrike | 100.0% | 93.3%(+6.70)#58 | 91.7%(+8.30)#4,026 |
| 58. | Waldorf | 100.0% | 93.3%(+6.70)#59 | 91.7%(+8.30)#4,076 |
| 59. | Erhard | 100.0% | 93.3%(+6.70)#60 | 91.7%(+8.30)#4,287 |
| 60. | Leota | 100.0% | 93.3%(+6.70)#61 | 91.7%(+8.30)#4,426 |
| 61. | Danvers | 100.0% | 93.3%(+6.70)#62 | 91.7%(+8.30)#4,479 |
| 62. | Pickwick | 100.0% | 93.3%(+6.70)#63 | 91.7%(+8.30)#4,480 |
| 63. | Silver Creek | 100.0% | 93.3%(+6.70)#64 | 91.7%(+8.30)#4,494 |
| 64. | Dumont | 100.0% | 93.3%(+6.70)#65 | 91.7%(+8.30)#4,526 |
| 65. | Harding | 100.0% | 93.3%(+6.70)#66 | 91.7%(+8.30)#4,534 |
| 66. | Riverton | 100.0% | 93.3%(+6.70)#67 | 91.7%(+8.30)#4,571 |
| 67. | Homer | 100.0% | 93.3%(+6.70)#68 | 91.7%(+8.30)#4,634 |
| 68. | Elkton | 100.0% | 93.3%(+6.70)#69 | 91.7%(+8.30)#4,707 |
| 69. | Merrifield | 100.0% | 93.3%(+6.70)#70 | 91.7%(+8.30)#4,782 |
| 70. | Ball Club | 100.0% | 93.3%(+6.70)#71 | 91.7%(+8.30)#4,827 |
| 71. | Knife River | 100.0% | 93.3%(+6.70)#72 | 91.7%(+8.30)#4,909 |
| 72. | Foxhome | 100.0% | 93.3%(+6.70)#73 | 91.7%(+8.30)#4,922 |
| 73. | Clitherall | 100.0% | 93.3%(+6.70)#74 | 91.7%(+8.30)#5,008 |
| 74. | Norcross | 100.0% | 93.3%(+6.70)#75 | 91.7%(+8.30)#5,059 |
| 75. | Steen | 100.0% | 93.3%(+6.70)#76 | 91.7%(+8.30)#5,060 |
| 76. | Seaforth | 100.0% | 93.3%(+6.70)#77 | 91.7%(+8.30)#5,074 |
| 77. | Spring Hill | 100.0% | 93.3%(+6.70)#78 | 91.7%(+8.30)#5,135 |
| 78. | Lastrup | 100.0% | 93.3%(+6.70)#79 | 91.7%(+8.30)#5,136 |
| 79. | Odessa | 100.0% | 93.3%(+6.70)#80 | 91.7%(+8.30)#5,158 |
| 80. | Effie | 100.0% | 93.3%(+6.70)#81 | 91.7%(+8.30)#5,200 |
| 81. | Stanchfield | 100.0% | 93.3%(+6.70)#82 | 91.7%(+8.30)#5,214 |
| 82. | Fort Ripley | 100.0% | 93.3%(+6.70)#83 | 91.7%(+8.30)#5,363 |
| 83. | Beltrami | 100.0% | 93.3%(+6.70)#84 | 91.7%(+8.30)#5,475 |
| 84. | Hazel Run | 100.0% | 93.3%(+6.70)#85 | 91.7%(+8.30)#5,477 |
| 85. | Darfur | 100.0% | 93.3%(+6.70)#86 | 91.7%(+8.30)#5,478 |
| 86. | West Union | 100.0% | 93.3%(+6.70)#87 | 91.7%(+8.30)#5,534 |
| 87. | Tamarack | 100.0% | 93.3%(+6.70)#88 | 91.7%(+8.30)#5,552 |
| 88. | Lake Henry | 100.0% | 93.3%(+6.70)#89 | 91.7%(+8.30)#5,553 |
| 89. | Strandquist | 100.0% | 93.3%(+6.70)#90 | 91.7%(+8.30)#5,576 |
| 90. | Comstock | 100.0% | 93.3%(+6.70)#91 | 91.7%(+8.30)#5,577 |
| 91. | Whalan | 100.0% | 93.3%(+6.70)#92 | 91.7%(+8.30)#5,645 |
| 92. | Evan | 100.0% | 93.3%(+6.70)#93 | 91.7%(+8.30)#5,646 |
| 93. | Clontarf | 100.0% | 93.3%(+6.70)#94 | 91.7%(+8.30)#5,647 |
| 94. | Trosky | 100.0% | 93.3%(+6.70)#95 | 91.7%(+8.30)#5,697 |
| 95. | Turtle River | 100.0% | 93.3%(+6.70)#96 | 91.7%(+8.30)#5,715 |
| 96. | Georgetown | 100.0% | 93.3%(+6.70)#97 | 91.7%(+8.30)#5,716 |
| 97. | Funkley | 100.0% | 93.3%(+6.70)#98 | 91.7%(+8.30)#5,829 |
| 98. | Tintah | 100.0% | 93.3%(+6.70)#99 | 91.7%(+8.30)#5,849 |
| 99. | Essig | 100.0% | 93.3%(+6.70)#100 | 91.7%(+8.30)#5,850 |
| 100. | Laporte | 100.0% | 93.3%(+6.70)#101 | 91.7%(+8.30)#5,893 |
Common Questions
What are the Top 10 Cities with the Highest Percentage of Households With One or more Vehicles in Minnesota?
Top 10 Cities with the Highest Percentage of Households With One or more Vehicles in Minnesota are:
What city has the Highest Percentage of Households With One or more Vehicles in Minnesota?
Tonka Bay has the Highest Percentage of Households With One or more Vehicles in Minnesota with 100.0%.
What is the Percentage of Households With One or more Vehicles in the State of Minnesota?
Percentage of Households With One or more Vehicles in Minnesota is 93.3%.
What is the Percentage of Households With One or more Vehicles in the United States?
Percentage of Households With One or more Vehicles in the United States is 91.7%.