Cities with the Highest Percentage of Households With One or more Vehicles in the United States
RELATED REPORTS & OPTIONS
Households with 1 or more Cars
United States
Compare Cities
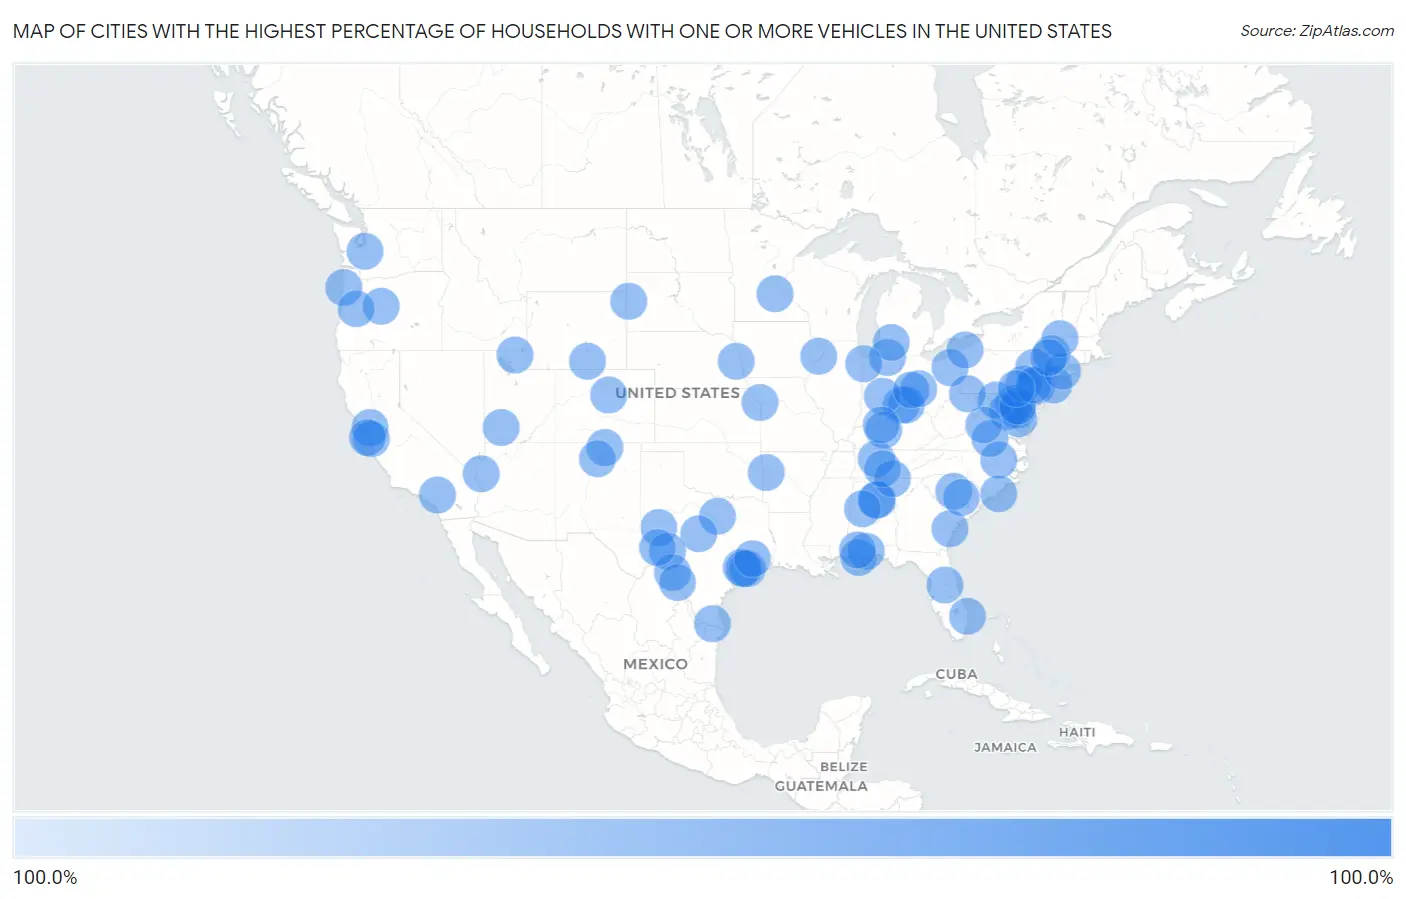
Map of Cities with the Highest Percentage of Households With One or more Vehicles in the United States
0.0%
100.0%
Cities with the Highest Percentage of Households With One or more Vehicles in the United States
| City | Housholds With 1+ Cars | vs State | vs National | |
| 1. | Francisville | 100.0% | 93.3%(+6.70)#1 | 91.7%(+8.30)#1 |
| 2. | Jessup | 100.0% | 91.3%(+8.70)#1 | 91.7%(+8.30)#2 |
| 3. | Camp Pendleton Mainside | 100.0% | 93.0%(+7.00)#1 | 91.7%(+8.30)#3 |
| 4. | Golden Valley | 100.0% | 94.5%(+5.50)#1 | 91.7%(+8.30)#4 |
| 5. | Highgrove | 100.0% | 93.0%(+7.00)#2 | 91.7%(+8.30)#5 |
| 6. | South Run | 100.0% | 93.9%(+6.10)#1 | 91.7%(+8.30)#6 |
| 7. | Fort Washington | 100.0% | 89.4%(+10.6)#1 | 91.7%(+8.30)#7 |
| 8. | Saranap | 100.0% | 93.0%(+7.00)#3 | 91.7%(+8.30)#8 |
| 9. | Turpin Hills | 100.0% | 92.5%(+7.50)#1 | 91.7%(+8.30)#9 |
| 10. | Willow Park | 100.0% | 94.8%(+5.20)#1 | 91.7%(+8.30)#10 |
| 11. | Shady Side | 100.0% | 91.3%(+8.70)#2 | 91.7%(+8.30)#11 |
| 12. | Blythewood | 100.0% | 94.3%(+5.70)#1 | 91.7%(+8.30)#12 |
| 13. | Odenville | 100.0% | 94.5%(+5.50)#1 | 91.7%(+8.30)#13 |
| 14. | Argo | 100.0% | 94.5%(+5.50)#2 | 91.7%(+8.30)#14 |
| 15. | Whiteland | 100.0% | 93.8%(+6.20)#1 | 91.7%(+8.30)#15 |
| 16. | Midway North | 100.0% | 94.8%(+5.20)#2 | 91.7%(+8.30)#16 |
| 17. | Weston Lakes | 100.0% | 94.8%(+5.20)#3 | 91.7%(+8.30)#17 |
| 18. | Middlebury | 100.0% | 93.8%(+6.20)#2 | 91.7%(+8.30)#18 |
| 19. | Wallace | 100.0% | 94.0%(+6.00)#1 | 91.7%(+8.30)#19 |
| 20. | Monte Sereno | 100.0% | 93.0%(+7.00)#4 | 91.7%(+8.30)#20 |
| 21. | Coleytown | 100.0% | 91.5%(+8.50)#1 | 91.7%(+8.30)#21 |
| 22. | Red Oak | 100.0% | 94.6%(+5.40)#1 | 91.7%(+8.30)#22 |
| 23. | Emerald Lakes | 100.0% | 89.4%(+10.6)#2 | 91.7%(+8.30)#23 |
| 24. | Cottondale | 100.0% | 94.5%(+5.50)#3 | 91.7%(+8.30)#24 |
| 25. | Brimfield | 100.0% | 92.5%(+7.50)#2 | 91.7%(+8.30)#25 |
| 26. | Early | 100.0% | 94.8%(+5.20)#4 | 91.7%(+8.30)#26 |
| 27. | Eagle Crest | 100.0% | 92.9%(+7.10)#1 | 91.7%(+8.30)#27 |
| 28. | Parowan | 100.0% | 96.1%(+3.90)#1 | 91.7%(+8.30)#28 |
| 29. | Rineyville | 100.0% | 93.3%(+6.70)#2 | 91.7%(+8.30)#29 |
| 30. | Henderson | 100.0% | 94.0%(+6.00)#1 | 91.7%(+8.30)#30 |
| 31. | Gluckstadt | 100.0% | 93.9%(+6.10)#1 | 91.7%(+8.30)#31 |
| 32. | Drum Point | 100.0% | 91.3%(+8.70)#3 | 91.7%(+8.30)#32 |
| 33. | Womelsdorf Borough | 100.0% | 89.4%(+10.6)#3 | 91.7%(+8.30)#33 |
| 34. | New Britain Borough | 100.0% | 89.4%(+10.6)#4 | 91.7%(+8.30)#34 |
| 35. | Park View | 100.0% | 94.4%(+5.60)#1 | 91.7%(+8.30)#35 |
| 36. | Inwood | 100.0% | 91.8%(+8.20)#1 | 91.7%(+8.30)#36 |
| 37. | Bon Secour | 100.0% | 94.5%(+5.50)#4 | 91.7%(+8.30)#37 |
| 38. | Eagle Point | 100.0% | 94.5%(+5.50)#5 | 91.7%(+8.30)#38 |
| 39. | Brisas Del Campanero | 100.0% | 86.0%(+14.0)#1 | 91.7%(+8.30)#39 |
| 40. | Herald Harbor | 100.0% | 91.3%(+8.70)#4 | 91.7%(+8.30)#40 |
| 41. | Stanton | 100.0% | 94.8%(+5.20)#5 | 91.7%(+8.30)#41 |
| 42. | Lavaca | 100.0% | 94.0%(+6.00)#1 | 91.7%(+8.30)#42 |
| 43. | Weatherby Lake | 100.0% | 93.4%(+6.60)#1 | 91.7%(+8.30)#43 |
| 44. | Stapleton | 100.0% | 94.5%(+5.50)#6 | 91.7%(+8.30)#44 |
| 45. | South Creek | 100.0% | 93.2%(+6.80)#1 | 91.7%(+8.30)#45 |
| 46. | Goose Creek | 100.0% | 93.9%(+6.10)#2 | 91.7%(+8.30)#46 |
| 47. | Pine Air | 100.0% | 94.0%(+6.00)#2 | 91.7%(+8.30)#47 |
| 48. | Ozona | 100.0% | 94.8%(+5.20)#6 | 91.7%(+8.30)#48 |
| 49. | West Belmar | 100.0% | 88.7%(+11.3)#1 | 91.7%(+8.30)#49 |
| 50. | Bear Creek Ranch | 100.0% | 94.8%(+5.20)#7 | 91.7%(+8.30)#50 |
| 51. | Choctaw Lake | 100.0% | 92.5%(+7.50)#3 | 91.7%(+8.30)#51 |
| 52. | Questa | 100.0% | 94.3%(+5.70)#1 | 91.7%(+8.30)#52 |
| 53. | Swartzville | 100.0% | 89.4%(+10.6)#5 | 91.7%(+8.30)#53 |
| 54. | Evansburg | 100.0% | 89.4%(+10.6)#6 | 91.7%(+8.30)#54 |
| 55. | Wedgefield | 100.0% | 94.3%(+5.70)#2 | 91.7%(+8.30)#55 |
| 56. | Rural Hill | 100.0% | 94.7%(+5.30)#1 | 91.7%(+8.30)#56 |
| 57. | Hampden Sydney | 100.0% | 93.9%(+6.10)#3 | 91.7%(+8.30)#57 |
| 58. | Sterling Ranch | 100.0% | 95.1%(+4.90)#1 | 91.7%(+8.30)#58 |
| 59. | Stone Ridge | 100.0% | 71.1%(+28.9)#1 | 91.7%(+8.30)#59 |
| 60. | Doe Valley | 100.0% | 93.3%(+6.70)#3 | 91.7%(+8.30)#60 |
| 61. | Laughlin Afb | 100.0% | 94.8%(+5.20)#8 | 91.7%(+8.30)#61 |
| 62. | Crest View Heights | 100.0% | 71.1%(+28.9)#2 | 91.7%(+8.30)#62 |
| 63. | Mill Plain | 100.0% | 91.5%(+8.50)#2 | 91.7%(+8.30)#63 |
| 64. | Benson | 100.0% | 96.1%(+3.90)#2 | 91.7%(+8.30)#64 |
| 65. | Lookout Mountain | 100.0% | 94.0%(+6.00)#2 | 91.7%(+8.30)#65 |
| 66. | North Spearfish | 100.0% | 95.0%(+5.00)#1 | 91.7%(+8.30)#66 |
| 67. | North Industry | 100.0% | 92.5%(+7.50)#4 | 91.7%(+8.30)#67 |
| 68. | Montverde | 100.0% | 94.0%(+6.00)#3 | 91.7%(+8.30)#68 |
| 69. | Huntington Bay | 100.0% | 71.1%(+28.9)#3 | 91.7%(+8.30)#69 |
| 70. | Pacific City | 100.0% | 92.9%(+7.10)#2 | 91.7%(+8.30)#70 |
| 71. | Lyndhurst | 100.0% | 93.9%(+6.10)#4 | 91.7%(+8.30)#71 |
| 72. | New Union | 100.0% | 94.7%(+5.30)#2 | 91.7%(+8.30)#72 |
| 73. | Saratoga | 100.0% | 96.2%(+3.80)#1 | 91.7%(+8.30)#73 |
| 74. | Baywood Park | 100.0% | 93.0%(+7.00)#5 | 91.7%(+8.30)#74 |
| 75. | Fredericksburg Cdp Lebanon County | 100.0% | 89.4%(+10.6)#7 | 91.7%(+8.30)#75 |
| 76. | Bakersfield Country Club | 100.0% | 93.0%(+7.00)#6 | 91.7%(+8.30)#76 |
| 77. | Yorklyn | 100.0% | 89.4%(+10.6)#8 | 91.7%(+8.30)#77 |
| 78. | Siesta Acres | 100.0% | 94.8%(+5.20)#9 | 91.7%(+8.30)#78 |
| 79. | Avonia | 100.0% | 89.4%(+10.6)#9 | 91.7%(+8.30)#79 |
| 80. | Averill Park | 100.0% | 71.1%(+28.9)#4 | 91.7%(+8.30)#80 |
| 81. | Crystal Lakes | 100.0% | 92.5%(+7.50)#5 | 91.7%(+8.30)#81 |
| 82. | Iraan | 100.0% | 94.8%(+5.20)#10 | 91.7%(+8.30)#82 |
| 83. | South Gull Lake | 100.0% | 92.8%(+7.20)#1 | 91.7%(+8.30)#83 |
| 84. | Cassville | 100.0% | 91.8%(+8.20)#2 | 91.7%(+8.30)#84 |
| 85. | Coburg | 100.0% | 92.9%(+7.10)#3 | 91.7%(+8.30)#85 |
| 86. | Sea Breeze | 100.0% | 94.6%(+5.40)#2 | 91.7%(+8.30)#86 |
| 87. | Fifth Street | 100.0% | 94.8%(+5.20)#11 | 91.7%(+8.30)#87 |
| 88. | Oak Bluffs | 100.0% | 88.1%(+11.9)#1 | 91.7%(+8.30)#88 |
| 89. | Arlington | 100.0% | 95.0%(+5.00)#1 | 91.7%(+8.30)#89 |
| 90. | La Villita | 100.0% | 94.3%(+5.70)#2 | 91.7%(+8.30)#90 |
| 91. | Cumings | 100.0% | 94.8%(+5.20)#12 | 91.7%(+8.30)#91 |
| 92. | Mountain View Ranches | 100.0% | 94.5%(+5.50)#2 | 91.7%(+8.30)#92 |
| 93. | Tonka Bay | 100.0% | 93.3%(+6.70)#1 | 91.7%(+8.30)#93 |
| 94. | Lake Dalecarlia | 100.0% | 93.8%(+6.20)#3 | 91.7%(+8.30)#94 |
| 95. | Indian Hills | 100.0% | 95.1%(+4.90)#2 | 91.7%(+8.30)#95 |
| 96. | Walker Valley | 100.0% | 71.1%(+28.9)#5 | 91.7%(+8.30)#96 |
| 97. | La Honda | 100.0% | 93.0%(+7.00)#7 | 91.7%(+8.30)#97 |
| 98. | Patton Village | 100.0% | 94.8%(+5.20)#13 | 91.7%(+8.30)#98 |
| 99. | South Dennis | 100.0% | 88.7%(+11.3)#2 | 91.7%(+8.30)#99 |
| 100. | Beech Island | 100.0% | 94.3%(+5.70)#3 | 91.7%(+8.30)#100 |
Common Questions
What are the Top 10 Cities with the Highest Percentage of Households With One or more Vehicles in the United States?
Top 10 Cities with the Highest Percentage of Households With One or more Vehicles in the United States are:
#1
100.0%
#2
100.0%
#3
100.0%
#4
100.0%
#5
100.0%
#6
100.0%
#7
100.0%
#8
100.0%
#9
100.0%
#10
100.0%
What city has the Highest Percentage of Households With One or more Vehicles in the United States?
Francisville has the Highest Percentage of Households With One or more Vehicles in the United States with 100.0%.
What is the Percentage of Households With One or more Vehicles in the United States?
Percentage of Households With One or more Vehicles in the United States is 91.7%.