Cities with the Highest Percentage of Households With One or more Vehicles in Iowa
RELATED REPORTS & OPTIONS
Households with 1 or more Cars
Iowa
Compare Cities
Map of Cities with the Highest Percentage of Households With One or more Vehicles in Iowa
0.0%
100.0%
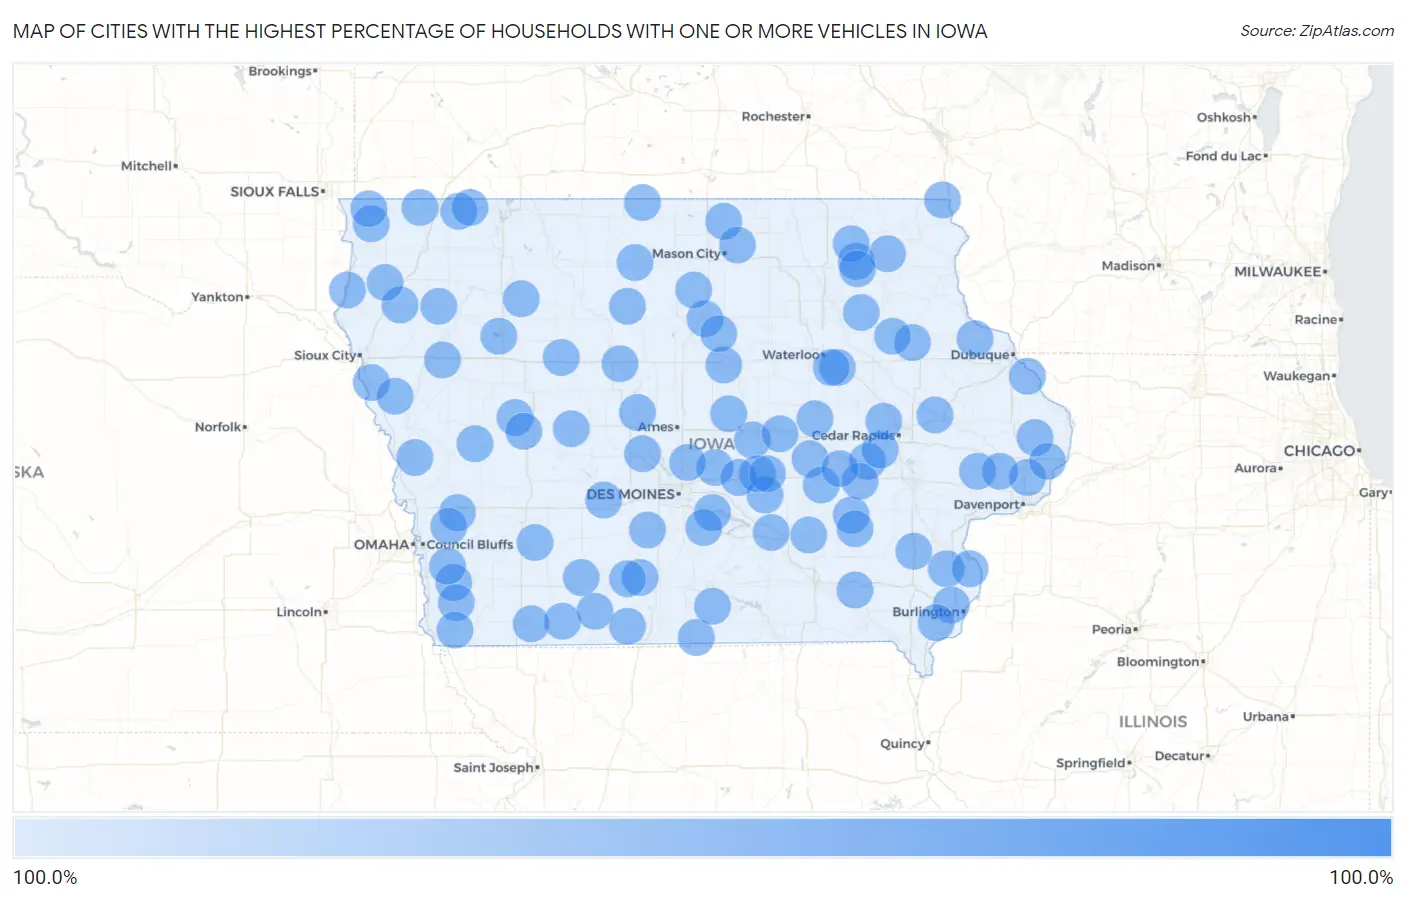
Cities with the Highest Percentage of Households With One or more Vehicles in Iowa
| City | Housholds With 1+ Cars | vs State | vs National | |
| 1. | Park View | 100.0% | 94.4% (+5.60)#1 | 91.7% (+8.30)#35 |
| 2. | Morning Sun | 100.0% | 94.4% (+5.60)#2 | 91.7% (+8.30)#175 |
| 3. | Murray | 100.0% | 94.4% (+5.60)#3 | 91.7% (+8.30)#198 |
| 4. | Ocheyedan | 100.0% | 94.4% (+5.60)#4 | 91.7% (+8.30)#224 |
| 5. | Holiday Lake | 100.0% | 94.4% (+5.60)#5 | 91.7% (+8.30)#305 |
| 6. | Mingo | 100.0% | 94.4% (+5.60)#6 | 91.7% (+8.30)#322 |
| 7. | Libertyville | 100.0% | 94.4% (+5.60)#7 | 91.7% (+8.30)#336 |
| 8. | Patterson | 100.0% | 94.4% (+5.60)#8 | 91.7% (+8.30)#348 |
| 9. | Kensett | 100.0% | 94.4% (+5.60)#9 | 91.7% (+8.30)#375 |
| 10. | Cumberland | 100.0% | 94.4% (+5.60)#10 | 91.7% (+8.30)#380 |
| 11. | South English | 100.0% | 94.4% (+5.60)#11 | 91.7% (+8.30)#399 |
| 12. | Alvord | 100.0% | 94.4% (+5.60)#12 | 91.7% (+8.30)#422 |
| 13. | Coulter | 100.0% | 94.4% (+5.60)#13 | 91.7% (+8.30)#451 |
| 14. | Marathon | 100.0% | 94.4% (+5.60)#14 | 91.7% (+8.30)#453 |
| 15. | Haverhill | 100.0% | 94.4% (+5.60)#15 | 91.7% (+8.30)#502 |
| 16. | Clemons | 100.0% | 94.4% (+5.60)#16 | 91.7% (+8.30)#521 |
| 17. | Rock Falls | 100.0% | 94.4% (+5.60)#17 | 91.7% (+8.30)#556 |
| 18. | St Donatus | 100.0% | 94.4% (+5.60)#18 | 91.7% (+8.30)#558 |
| 19. | Harper | 100.0% | 94.4% (+5.60)#19 | 91.7% (+8.30)#562 |
| 20. | Fraser | 100.0% | 94.4% (+5.60)#20 | 91.7% (+8.30)#563 |
| 21. | Oyens | 100.0% | 94.4% (+5.60)#21 | 91.7% (+8.30)#569 |
| 22. | Swedesburg | 100.0% | 94.4% (+5.60)#22 | 91.7% (+8.30)#587 |
| 23. | Stone City | 100.0% | 94.4% (+5.60)#23 | 91.7% (+8.30)#592 |
| 24. | High Amana | 100.0% | 94.4% (+5.60)#24 | 91.7% (+8.30)#615 |
| 25. | Chatsworth | 100.0% | 94.4% (+5.60)#25 | 91.7% (+8.30)#639 |
| 26. | Cromwell | 100.0% | 94.4% (+5.60)#26 | 91.7% (+8.30)#642 |
| 27. | Guernsey | 100.0% | 94.4% (+5.60)#27 | 91.7% (+8.30)#670 |
| 28. | Swan | 100.0% | 94.4% (+5.60)#28 | 91.7% (+8.30)#673 |
| 29. | Sandyville | 100.0% | 94.4% (+5.60)#29 | 91.7% (+8.30)#689 |
| 30. | Thayer | 100.0% | 94.4% (+5.60)#30 | 91.7% (+8.30)#694 |
| 31. | Clio | 100.0% | 94.4% (+5.60)#31 | 91.7% (+8.30)#703 |
| 32. | Buck Grove | 100.0% | 94.4% (+5.60)#32 | 91.7% (+8.30)#714 |
| 33. | Jackson Junction | 100.0% | 94.4% (+5.60)#33 | 91.7% (+8.30)#715 |
| 34. | Millerton | 100.0% | 94.4% (+5.60)#34 | 91.7% (+8.30)#720 |
| 35. | Conway | 100.0% | 94.4% (+5.60)#35 | 91.7% (+8.30)#722 |
| 36. | Owasa | 100.0% | 94.4% (+5.60)#36 | 91.7% (+8.30)#737 |
| 37. | Hardy | 100.0% | 94.4% (+5.60)#37 | 91.7% (+8.30)#742 |
| 38. | Williamsburg | 100.0% | 94.4% (+5.60)#38 | 91.7% (+8.30)#904 |
| 39. | Walford | 100.0% | 94.4% (+5.60)#39 | 91.7% (+8.30)#1,286 |
| 40. | Malvern | 100.0% | 94.4% (+5.60)#40 | 91.7% (+8.30)#1,383 |
| 41. | Palo | 100.0% | 94.4% (+5.60)#41 | 91.7% (+8.30)#1,453 |
| 42. | Sully | 100.0% | 94.4% (+5.60)#42 | 91.7% (+8.30)#1,542 |
| 43. | Woodward | 100.0% | 94.4% (+5.60)#43 | 91.7% (+8.30)#1,570 |
| 44. | Arcadia | 100.0% | 94.4% (+5.60)#44 | 91.7% (+8.30)#1,662 |
| 45. | Ossian | 100.0% | 94.4% (+5.60)#45 | 91.7% (+8.30)#1,730 |
| 46. | Gilbertville | 100.0% | 94.4% (+5.60)#46 | 91.7% (+8.30)#1,807 |
| 47. | Minden | 100.0% | 94.4% (+5.60)#47 | 91.7% (+8.30)#1,867 |
| 48. | Beaverdale | 100.0% | 94.4% (+5.60)#48 | 91.7% (+8.30)#1,886 |
| 49. | Lakeside | 100.0% | 94.4% (+5.60)#49 | 91.7% (+8.30)#1,966 |
| 50. | Denmark | 100.0% | 94.4% (+5.60)#50 | 91.7% (+8.30)#2,003 |
| 51. | Kellogg | 100.0% | 94.4% (+5.60)#51 | 91.7% (+8.30)#2,021 |
| 52. | Washburn | 100.0% | 94.4% (+5.60)#52 | 91.7% (+8.30)#2,110 |
| 53. | Coalville | 100.0% | 94.4% (+5.60)#53 | 91.7% (+8.30)#2,140 |
| 54. | Elkhart | 100.0% | 94.4% (+5.60)#54 | 91.7% (+8.30)#2,203 |
| 55. | Scranton | 100.0% | 94.4% (+5.60)#55 | 91.7% (+8.30)#2,282 |
| 56. | New Albin | 100.0% | 94.4% (+5.60)#56 | 91.7% (+8.30)#2,386 |
| 57. | Twin Lakes | 100.0% | 94.4% (+5.60)#57 | 91.7% (+8.30)#2,395 |
| 58. | Diagonal | 100.0% | 94.4% (+5.60)#58 | 91.7% (+8.30)#2,442 |
| 59. | Salix | 100.0% | 94.4% (+5.60)#59 | 91.7% (+8.30)#2,494 |
| 60. | Little Rock | 100.0% | 94.4% (+5.60)#60 | 91.7% (+8.30)#2,551 |
| 61. | Charlotte | 100.0% | 94.4% (+5.60)#61 | 91.7% (+8.30)#2,592 |
| 62. | Bennett | 100.0% | 94.4% (+5.60)#62 | 91.7% (+8.30)#2,605 |
| 63. | Silver City | 100.0% | 94.4% (+5.60)#63 | 91.7% (+8.30)#2,660 |
| 64. | New Market | 100.0% | 94.4% (+5.60)#64 | 91.7% (+8.30)#2,784 |
| 65. | Crawfordsville | 100.0% | 94.4% (+5.60)#65 | 91.7% (+8.30)#2,799 |
| 66. | Protivin | 100.0% | 94.4% (+5.60)#66 | 91.7% (+8.30)#2,808 |
| 67. | Wesley | 100.0% | 94.4% (+5.60)#67 | 91.7% (+8.30)#2,839 |
| 68. | Halbur | 100.0% | 94.4% (+5.60)#68 | 91.7% (+8.30)#2,919 |
| 69. | Waucoma | 100.0% | 94.4% (+5.60)#69 | 91.7% (+8.30)#3,059 |
| 70. | Lester | 100.0% | 94.4% (+5.60)#70 | 91.7% (+8.30)#3,105 |
| 71. | Hornick | 100.0% | 94.4% (+5.60)#71 | 91.7% (+8.30)#3,155 |
| 72. | Holy Cross | 100.0% | 94.4% (+5.60)#72 | 91.7% (+8.30)#3,193 |
| 73. | Cleghorn | 100.0% | 94.4% (+5.60)#73 | 91.7% (+8.30)#3,215 |
| 74. | Meservey | 100.0% | 94.4% (+5.60)#74 | 91.7% (+8.30)#3,236 |
| 75. | Lambs Grove | 100.0% | 94.4% (+5.60)#75 | 91.7% (+8.30)#3,243 |
| 76. | Moscow | 100.0% | 94.4% (+5.60)#76 | 91.7% (+8.30)#3,277 |
| 77. | Clutier | 100.0% | 94.4% (+5.60)#77 | 91.7% (+8.30)#3,286 |
| 78. | Randolph | 100.0% | 94.4% (+5.60)#78 | 91.7% (+8.30)#3,339 |
| 79. | Riverton | 100.0% | 94.4% (+5.60)#79 | 91.7% (+8.30)#3,342 |
| 80. | Rose Hill | 100.0% | 94.4% (+5.60)#80 | 91.7% (+8.30)#3,347 |
| 81. | Ladora | 100.0% | 94.4% (+5.60)#81 | 91.7% (+8.30)#3,391 |
| 82. | Diamondhead Lake | 100.0% | 94.4% (+5.60)#82 | 91.7% (+8.30)#3,429 |
| 83. | Pisgah | 100.0% | 94.4% (+5.60)#84 | 91.7% (+8.30)#3,462 |
| 84. | Low Moor | 100.0% | 94.4% (+5.60)#85 | 91.7% (+8.30)#3,463 |
| 85. | Kellerton | 100.0% | 94.4% (+5.60)#86 | 91.7% (+8.30)#3,476 |
| 86. | Maurice | 100.0% | 94.4% (+5.60)#87 | 91.7% (+8.30)#3,485 |
| 87. | Bradford | 100.0% | 94.4% (+5.60)#88 | 91.7% (+8.30)#3,507 |
| 88. | Cushing | 100.0% | 94.4% (+5.60)#89 | 91.7% (+8.30)#3,607 |
| 89. | Dixon | 100.0% | 94.4% (+5.60)#90 | 91.7% (+8.30)#3,614 |
| 90. | Dundee | 100.0% | 94.4% (+5.60)#91 | 91.7% (+8.30)#3,633 |
| 91. | Westgate | 100.0% | 94.4% (+5.60)#92 | 91.7% (+8.30)#3,781 |
| 92. | Oakville | 100.0% | 94.4% (+5.60)#93 | 91.7% (+8.30)#3,827 |
| 93. | Aurora | 100.0% | 94.4% (+5.60)#94 | 91.7% (+8.30)#3,872 |
| 94. | Oakland Acres | 100.0% | 94.4% (+5.60)#95 | 91.7% (+8.30)#3,907 |
| 95. | Montour | 100.0% | 94.4% (+5.60)#96 | 91.7% (+8.30)#3,917 |
| 96. | Harris | 100.0% | 94.4% (+5.60)#97 | 91.7% (+8.30)#3,918 |
| 97. | Rake | 100.0% | 94.4% (+5.60)#98 | 91.7% (+8.30)#3,964 |
| 98. | Bentley | 100.0% | 94.4% (+5.60)#99 | 91.7% (+8.30)#4,020 |
| 99. | Leighton | 100.0% | 94.4% (+5.60)#100 | 91.7% (+8.30)#4,052 |
| 100. | Wever | 100.0% | 94.4% (+5.60)#101 | 91.7% (+8.30)#4,064 |
Common Questions
What are the Top 10 Cities with the Highest Percentage of Households With One or more Vehicles in Iowa?
Top 10 Cities with the Highest Percentage of Households With One or more Vehicles in Iowa are:
#1
100.0%
#2
100.0%
#3
100.0%
#4
100.0%
#5
100.0%
#6
100.0%
#7
100.0%
#8
100.0%
#9
100.0%
#10
100.0%
What city has the Highest Percentage of Households With One or more Vehicles in Iowa?
Park View has the Highest Percentage of Households With One or more Vehicles in Iowa with 100.0%.
What is the Percentage of Households With One or more Vehicles in the State of Iowa?
Percentage of Households With One or more Vehicles in Iowa is 94.4%.
What is the Percentage of Households With One or more Vehicles in the United States?
Percentage of Households With One or more Vehicles in the United States is 91.7%.