Cities with the Highest Percentage of Households With One or more Vehicles in Florida
RELATED REPORTS & OPTIONS
Households with 1 or more Cars
Florida
Compare Cities
Map of Cities with the Highest Percentage of Households With One or more Vehicles in Florida
0.0%
100.0%
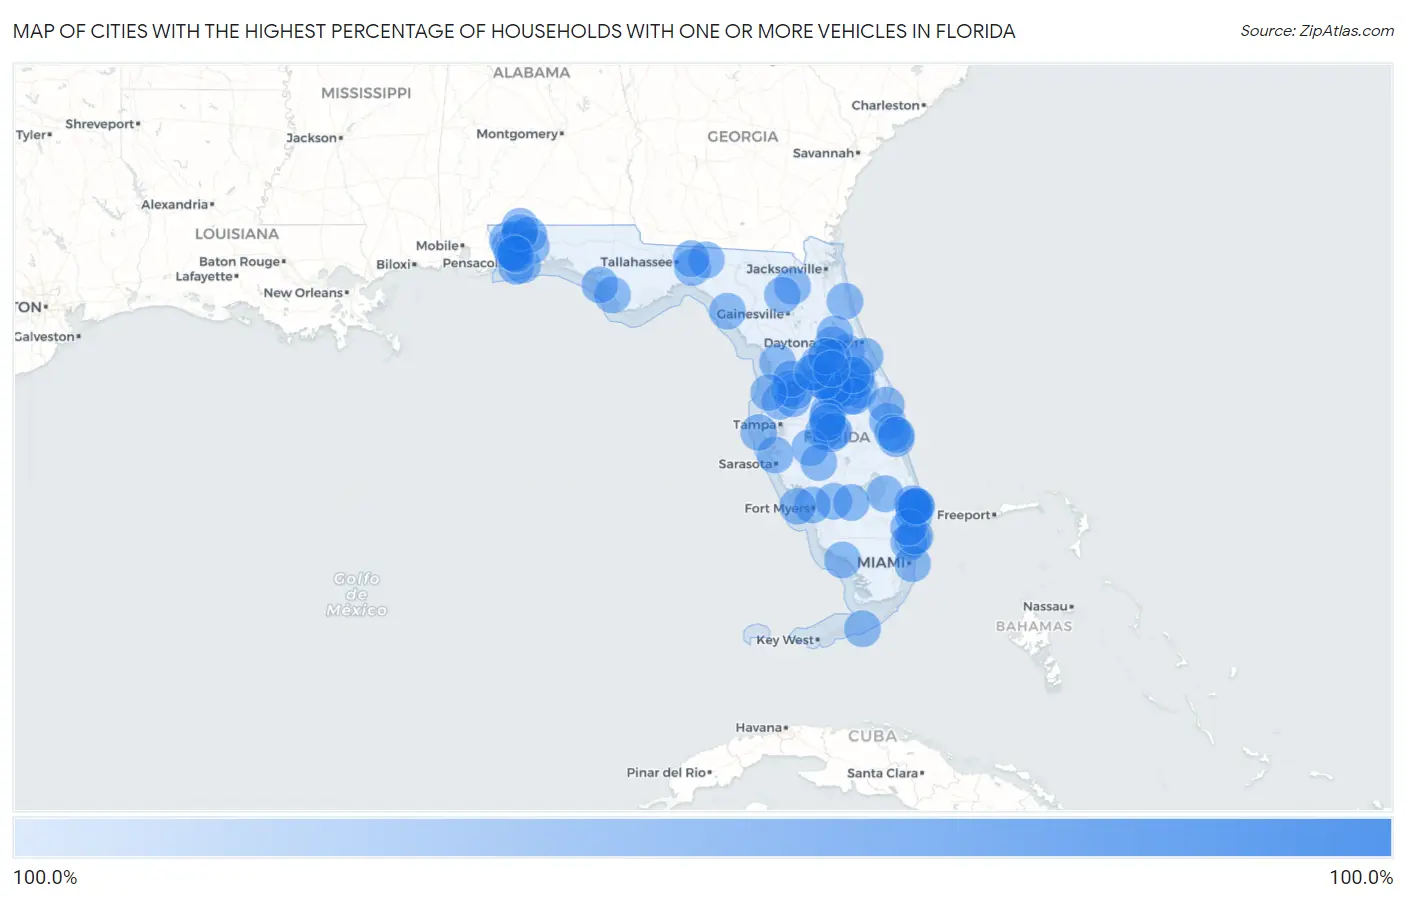
Cities with the Highest Percentage of Households With One or more Vehicles in Florida
| City | Housholds With 1+ Cars | vs State | vs National | |
| 1. | Wallace | 100.0% | 94.0%(+6.00)#1 | 91.7%(+8.30)#19 |
| 2. | Pine Air | 100.0% | 94.0%(+6.00)#2 | 91.7%(+8.30)#47 |
| 3. | Montverde | 100.0% | 94.0%(+6.00)#3 | 91.7%(+8.30)#68 |
| 4. | North Deland | 100.0% | 94.0%(+6.00)#4 | 91.7%(+8.30)#112 |
| 5. | Chumuckla | 100.0% | 94.0%(+6.00)#5 | 91.7%(+8.30)#144 |
| 6. | Lake Hart | 100.0% | 94.0%(+6.00)#6 | 91.7%(+8.30)#249 |
| 7. | Hillcrest Heights | 100.0% | 94.0%(+6.00)#7 | 91.7%(+8.30)#313 |
| 8. | Wacissa | 100.0% | 94.0%(+6.00)#8 | 91.7%(+8.30)#334 |
| 9. | Golf | 100.0% | 94.0%(+6.00)#9 | 91.7%(+8.30)#392 |
| 10. | Cloud Lake | 100.0% | 94.0%(+6.00)#10 | 91.7%(+8.30)#440 |
| 11. | Lazy Lake | 100.0% | 94.0%(+6.00)#11 | 91.7%(+8.30)#537 |
| 12. | Dixonville | 100.0% | 94.0%(+6.00)#12 | 91.7%(+8.30)#682 |
| 13. | Davenport | 100.0% | 94.0%(+6.00)#13 | 91.7%(+8.30)#752 |
| 14. | Wedgefield | 100.0% | 94.0%(+6.00)#14 | 91.7%(+8.30)#759 |
| 15. | Broadview Park | 100.0% | 94.0%(+6.00)#15 | 91.7%(+8.30)#764 |
| 16. | Connerton | 100.0% | 94.0%(+6.00)#16 | 91.7%(+8.30)#778 |
| 17. | Rio Pinar | 100.0% | 94.0%(+6.00)#17 | 91.7%(+8.30)#791 |
| 18. | St Augustine South | 100.0% | 94.0%(+6.00)#18 | 91.7%(+8.30)#809 |
| 19. | Whitfield Cdp Manatee County | 100.0% | 94.0%(+6.00)#19 | 91.7%(+8.30)#810 |
| 20. | Pensacola Station | 100.0% | 94.0%(+6.00)#20 | 91.7%(+8.30)#812 |
| 21. | Bay Hill | 100.0% | 94.0%(+6.00)#21 | 91.7%(+8.30)#835 |
| 22. | Winter Beach | 100.0% | 94.0%(+6.00)#22 | 91.7%(+8.30)#838 |
| 23. | Samoset | 100.0% | 94.0%(+6.00)#23 | 91.7%(+8.30)#839 |
| 24. | Florida Gulf Coast University | 100.0% | 94.0%(+6.00)#24 | 91.7%(+8.30)#865 |
| 25. | Alturas | 100.0% | 94.0%(+6.00)#25 | 91.7%(+8.30)#891 |
| 26. | Geneva | 100.0% | 94.0%(+6.00)#26 | 91.7%(+8.30)#909 |
| 27. | Woodlawn Beach | 100.0% | 94.0%(+6.00)#27 | 91.7%(+8.30)#921 |
| 28. | Rainbow Lakes Estates | 100.0% | 94.0%(+6.00)#28 | 91.7%(+8.30)#925 |
| 29. | Windermere | 100.0% | 94.0%(+6.00)#29 | 91.7%(+8.30)#931 |
| 30. | Ocala Estates | 100.0% | 94.0%(+6.00)#30 | 91.7%(+8.30)#937 |
| 31. | Malabar | 100.0% | 94.0%(+6.00)#31 | 91.7%(+8.30)#943 |
| 32. | Hurlburt Field | 100.0% | 94.0%(+6.00)#32 | 91.7%(+8.30)#957 |
| 33. | Chuluota | 100.0% | 94.0%(+6.00)#33 | 91.7%(+8.30)#998 |
| 34. | Berkshire Lakes | 100.0% | 94.0%(+6.00)#34 | 91.7%(+8.30)#1,000 |
| 35. | St Leo | 100.0% | 94.0%(+6.00)#35 | 91.7%(+8.30)#1,006 |
| 36. | Tangelo Park | 100.0% | 94.0%(+6.00)#36 | 91.7%(+8.30)#1,018 |
| 37. | Vilano Beach | 100.0% | 94.0%(+6.00)#37 | 91.7%(+8.30)#1,029 |
| 38. | Lake Mary Jane | 100.0% | 94.0%(+6.00)#38 | 91.7%(+8.30)#1,058 |
| 39. | Redington Shores | 100.0% | 94.0%(+6.00)#39 | 91.7%(+8.30)#1,073 |
| 40. | Oriole Beach | 100.0% | 94.0%(+6.00)#40 | 91.7%(+8.30)#1,157 |
| 41. | Fort Denaud | 100.0% | 94.0%(+6.00)#41 | 91.7%(+8.30)#1,176 |
| 42. | Gotha | 100.0% | 94.0%(+6.00)#42 | 91.7%(+8.30)#1,184 |
| 43. | Lake Hamilton | 100.0% | 94.0%(+6.00)#43 | 91.7%(+8.30)#1,197 |
| 44. | Patrick Afb | 100.0% | 94.0%(+6.00)#44 | 91.7%(+8.30)#1,202 |
| 45. | Old Miakka | 100.0% | 94.0%(+6.00)#45 | 91.7%(+8.30)#1,208 |
| 46. | Astor | 100.0% | 94.0%(+6.00)#46 | 91.7%(+8.30)#1,265 |
| 47. | Glencoe | 100.0% | 94.0%(+6.00)#47 | 91.7%(+8.30)#1,294 |
| 48. | Yalaha | 100.0% | 94.0%(+6.00)#48 | 91.7%(+8.30)#1,300 |
| 49. | Roseland | 100.0% | 94.0%(+6.00)#49 | 91.7%(+8.30)#1,323 |
| 50. | Seville | 100.0% | 94.0%(+6.00)#50 | 91.7%(+8.30)#1,351 |
| 51. | Black Diamond | 100.0% | 94.0%(+6.00)#51 | 91.7%(+8.30)#1,425 |
| 52. | Black Hammock | 100.0% | 94.0%(+6.00)#52 | 91.7%(+8.30)#1,462 |
| 53. | Palmona Park | 100.0% | 94.0%(+6.00)#53 | 91.7%(+8.30)#1,476 |
| 54. | Babson Park | 100.0% | 94.0%(+6.00)#54 | 91.7%(+8.30)#1,495 |
| 55. | Paisley | 100.0% | 94.0%(+6.00)#55 | 91.7%(+8.30)#1,496 |
| 56. | Chokoloskee | 100.0% | 94.0%(+6.00)#56 | 91.7%(+8.30)#1,510 |
| 57. | Mexico Beach | 100.0% | 94.0%(+6.00)#57 | 91.7%(+8.30)#1,518 |
| 58. | Allentown | 100.0% | 94.0%(+6.00)#58 | 91.7%(+8.30)#1,537 |
| 59. | Winding Cypress | 100.0% | 94.0%(+6.00)#59 | 91.7%(+8.30)#1,636 |
| 60. | Scottsmoor | 100.0% | 94.0%(+6.00)#60 | 91.7%(+8.30)#1,645 |
| 61. | Harold | 100.0% | 94.0%(+6.00)#61 | 91.7%(+8.30)#1,712 |
| 62. | Avalon | 100.0% | 94.0%(+6.00)#62 | 91.7%(+8.30)#1,797 |
| 63. | Tyndall Afb | 100.0% | 94.0%(+6.00)#63 | 91.7%(+8.30)#1,844 |
| 64. | Desoto Acres | 100.0% | 94.0%(+6.00)#64 | 91.7%(+8.30)#1,896 |
| 65. | Fisher Island | 100.0% | 94.0%(+6.00)#65 | 91.7%(+8.30)#1,938 |
| 66. | Indian Lake Estates | 100.0% | 94.0%(+6.00)#66 | 91.7%(+8.30)#1,955 |
| 67. | Key Colony Beach | 100.0% | 94.0%(+6.00)#67 | 91.7%(+8.30)#1,999 |
| 68. | Whitfield Cdp Santa Rosa County | 100.0% | 94.0%(+6.00)#68 | 91.7%(+8.30)#2,030 |
| 69. | Marco Shores-Hammock Bay | 100.0% | 94.0%(+6.00)#69 | 91.7%(+8.30)#2,057 |
| 70. | Ferndale | 100.0% | 94.0%(+6.00)#70 | 91.7%(+8.30)#2,064 |
| 71. | Fort Green Springs | 100.0% | 94.0%(+6.00)#71 | 91.7%(+8.30)#2,154 |
| 72. | Stacey Street | 100.0% | 94.0%(+6.00)#72 | 91.7%(+8.30)#2,256 |
| 73. | Steinhatchee | 100.0% | 94.0%(+6.00)#73 | 91.7%(+8.30)#2,300 |
| 74. | Gardner | 100.0% | 94.0%(+6.00)#74 | 91.7%(+8.30)#2,346 |
| 75. | Sea Ranch Lakes | 100.0% | 94.0%(+6.00)#75 | 91.7%(+8.30)#2,499 |
| 76. | Canal Point | 100.0% | 94.0%(+6.00)#76 | 91.7%(+8.30)#2,519 |
| 77. | Pioneer | 100.0% | 94.0%(+6.00)#77 | 91.7%(+8.30)#2,591 |
| 78. | Munson | 100.0% | 94.0%(+6.00)#78 | 91.7%(+8.30)#2,698 |
| 79. | Pineland | 100.0% | 94.0%(+6.00)#79 | 91.7%(+8.30)#2,747 |
| 80. | Spring Lake | 100.0% | 94.0%(+6.00)#80 | 91.7%(+8.30)#2,782 |
| 81. | Acacia Villas | 100.0% | 94.0%(+6.00)#81 | 91.7%(+8.30)#2,815 |
| 82. | Hillsboro Pines | 100.0% | 94.0%(+6.00)#82 | 91.7%(+8.30)#2,934 |
| 83. | Trilby | 100.0% | 94.0%(+6.00)#83 | 91.7%(+8.30)#2,959 |
| 84. | Miccosukee | 100.0% | 94.0%(+6.00)#84 | 91.7%(+8.30)#2,992 |
| 85. | Raiford | 100.0% | 94.0%(+6.00)#85 | 91.7%(+8.30)#3,298 |
| 86. | Waverly | 100.0% | 94.0%(+6.00)#86 | 91.7%(+8.30)#3,309 |
| 87. | Worthington Springs | 100.0% | 94.0%(+6.00)#87 | 91.7%(+8.30)#3,310 |
| 88. | Nobleton | 100.0% | 94.0%(+6.00)#88 | 91.7%(+8.30)#3,439 |
| 89. | Lisbon | 100.0% | 94.0%(+6.00)#89 | 91.7%(+8.30)#3,448 |
| 90. | Floridatown | 100.0% | 94.0%(+6.00)#90 | 91.7%(+8.30)#3,533 |
| 91. | Windsor | 100.0% | 94.0%(+6.00)#91 | 91.7%(+8.30)#3,540 |
| 92. | Okahumpka | 100.0% | 94.0%(+6.00)#92 | 91.7%(+8.30)#3,678 |
| 93. | Glen Ridge | 100.0% | 94.0%(+6.00)#93 | 91.7%(+8.30)#3,687 |
| 94. | Pittman | 100.0% | 94.0%(+6.00)#94 | 91.7%(+8.30)#3,731 |
| 95. | Aripeka | 100.0% | 94.0%(+6.00)#95 | 91.7%(+8.30)#3,986 |
| 96. | Berrydale | 100.0% | 94.0%(+6.00)#96 | 91.7%(+8.30)#4,033 |
| 97. | Aucilla | 100.0% | 94.0%(+6.00)#97 | 91.7%(+8.30)#4,045 |
| 98. | Lloyd | 100.0% | 94.0%(+6.00)#98 | 91.7%(+8.30)#4,065 |
| 99. | Mulat | 100.0% | 94.0%(+6.00)#99 | 91.7%(+8.30)#4,093 |
| 100. | Sorrento | 100.0% | 94.0%(+6.00)#100 | 91.7%(+8.30)#4,193 |
Common Questions
What are the Top 10 Cities with the Highest Percentage of Households With One or more Vehicles in Florida?
Top 10 Cities with the Highest Percentage of Households With One or more Vehicles in Florida are:
#1
100.0%
#2
100.0%
#3
100.0%
#4
100.0%
#5
100.0%
#6
100.0%
#7
100.0%
#8
100.0%
#9
100.0%
#10
100.0%
What city has the Highest Percentage of Households With One or more Vehicles in Florida?
Wallace has the Highest Percentage of Households With One or more Vehicles in Florida with 100.0%.
What is the Percentage of Households With One or more Vehicles in the State of Florida?
Percentage of Households With One or more Vehicles in Florida is 94.0%.
What is the Percentage of Households With One or more Vehicles in the United States?
Percentage of Households With One or more Vehicles in the United States is 91.7%.