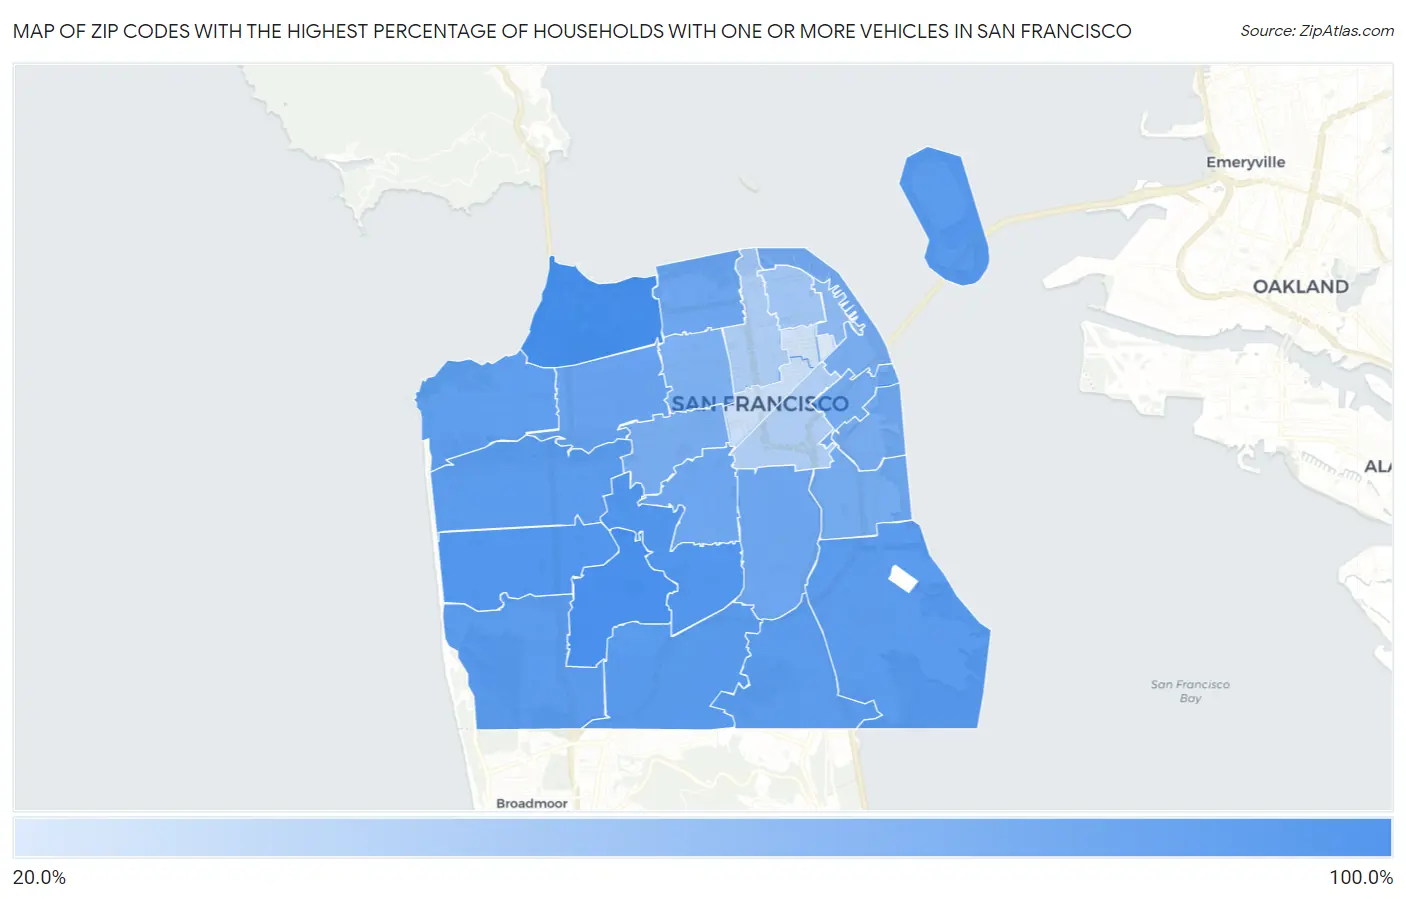
Zip Codes with the Highest Percentage of Households With One or more Vehicles in San Francisco, CA
RELATED REPORTS & OPTIONS
Households with 1 or more Cars
San Francisco
Compare Zip Codes
Map of Zip Codes with the Highest Percentage of Households With One or more Vehicles in San Francisco
25.8%
95.8%
Zip Codes with the Highest Percentage of Households With One or more Vehicles in San Francisco, CA
| Zip Code | Housholds With 1+ Cars | vs State | vs National | |
| 1. | 94129 | 95.8% | 93.0%(+2.80)#852 | 91.7%(+4.10)#17,636 |
| 2. | 94127 | 94.1% | 93.0%(+1.10)#1,105 | 91.7%(+2.40)#21,991 |
| 3. | 94131 | 89.6% | 93.0%(-3.40)#1,512 | 91.7%(-2.10)#28,220 |
| 4. | 94116 | 89.5% | 93.0%(-3.50)#1,514 | 91.7%(-2.20)#28,302 |
| 5. | 94112 | 87.2% | 93.0%(-5.80)#1,572 | 91.7%(-4.50)#29,609 |
| 6. | 94130 | 85.0% | 93.0%(-8.00)#1,615 | 91.7%(-6.70)#30,426 |
| 7. | 94124 | 84.8% | 93.0%(-8.20)#1,620 | 91.7%(-6.90)#30,467 |
| 8. | 94134 | 84.7% | 93.0%(-8.30)#1,622 | 91.7%(-7.00)#30,497 |
| 9. | 94132 | 84.7% | 93.0%(-8.30)#1,623 | 91.7%(-7.00)#30,501 |
| 10. | 94122 | 84.2% | 93.0%(-8.80)#1,630 | 91.7%(-7.50)#30,607 |
| 11. | 94121 | 81.1% | 93.0%(-11.9)#1,655 | 91.7%(-10.6)#31,152 |
| 12. | 94118 | 77.8% | 93.0%(-15.2)#1,671 | 91.7%(-13.9)#31,530 |
| 13. | 94123 | 74.8% | 93.0%(-18.2)#1,684 | 91.7%(-16.9)#31,760 |
| 14. | 94110 | 74.7% | 93.0%(-18.3)#1,686 | 91.7%(-17.0)#31,766 |
| 15. | 94114 | 74.1% | 93.0%(-18.9)#1,687 | 91.7%(-17.6)#31,806 |
| 16. | 94107 | 71.4% | 93.0%(-21.6)#1,693 | 91.7%(-20.3)#31,952 |
| 17. | 94117 | 70.1% | 93.0%(-22.9)#1,696 | 91.7%(-21.6)#32,011 |
| 18. | 94158 | 70.1% | 93.0%(-22.9)#1,697 | 91.7%(-21.6)#32,013 |
| 19. | 94105 | 68.3% | 93.0%(-24.7)#1,700 | 91.7%(-23.4)#32,083 |
| 20. | 94115 | 66.8% | 93.0%(-26.2)#1,702 | 91.7%(-24.9)#32,129 |
| 21. | 94111 | 59.8% | 93.0%(-33.2)#1,704 | 91.7%(-31.9)#32,310 |
| 22. | 94133 | 50.3% | 93.0%(-42.7)#1,712 | 91.7%(-41.4)#32,470 |
| 23. | 94109 | 44.9% | 93.0%(-48.1)#1,718 | 91.7%(-46.8)#32,513 |
| 24. | 94103 | 44.0% | 93.0%(-49.0)#1,719 | 91.7%(-47.7)#32,518 |
| 25. | 94102 | 32.6% | 93.0%(-60.4)#1,720 | 91.7%(-59.1)#32,604 |
| 26. | 94108 | 31.3% | 93.0%(-61.7)#1,721 | 91.7%(-60.4)#32,612 |
| 27. | 94104 | 25.8% | 93.0%(-67.2)#1,722 | 91.7%(-65.9)#32,652 |
1
Common Questions
What are the Top 10 Zip Codes with the Highest Percentage of Households With One or more Vehicles in San Francisco, CA?
Top 10 Zip Codes with the Highest Percentage of Households With One or more Vehicles in San Francisco, CA are:
What zip code has the Highest Percentage of Households With One or more Vehicles in San Francisco, CA?
94129 has the Highest Percentage of Households With One or more Vehicles in San Francisco, CA with 95.8%.
What is the Percentage of Households With One or more Vehicles in San Francisco, CA?
Percentage of Households With One or more Vehicles in San Francisco is 70.1%.
What is the Percentage of Households With One or more Vehicles in California?
Percentage of Households With One or more Vehicles in California is 93.0%.
What is the Percentage of Households With One or more Vehicles in the United States?
Percentage of Households With One or more Vehicles in the United States is 91.7%.