Cities with the Highest Percentage of Population Employed in Transportation in New York
RELATED REPORTS & OPTIONS
Transportation
New York
Compare Cities
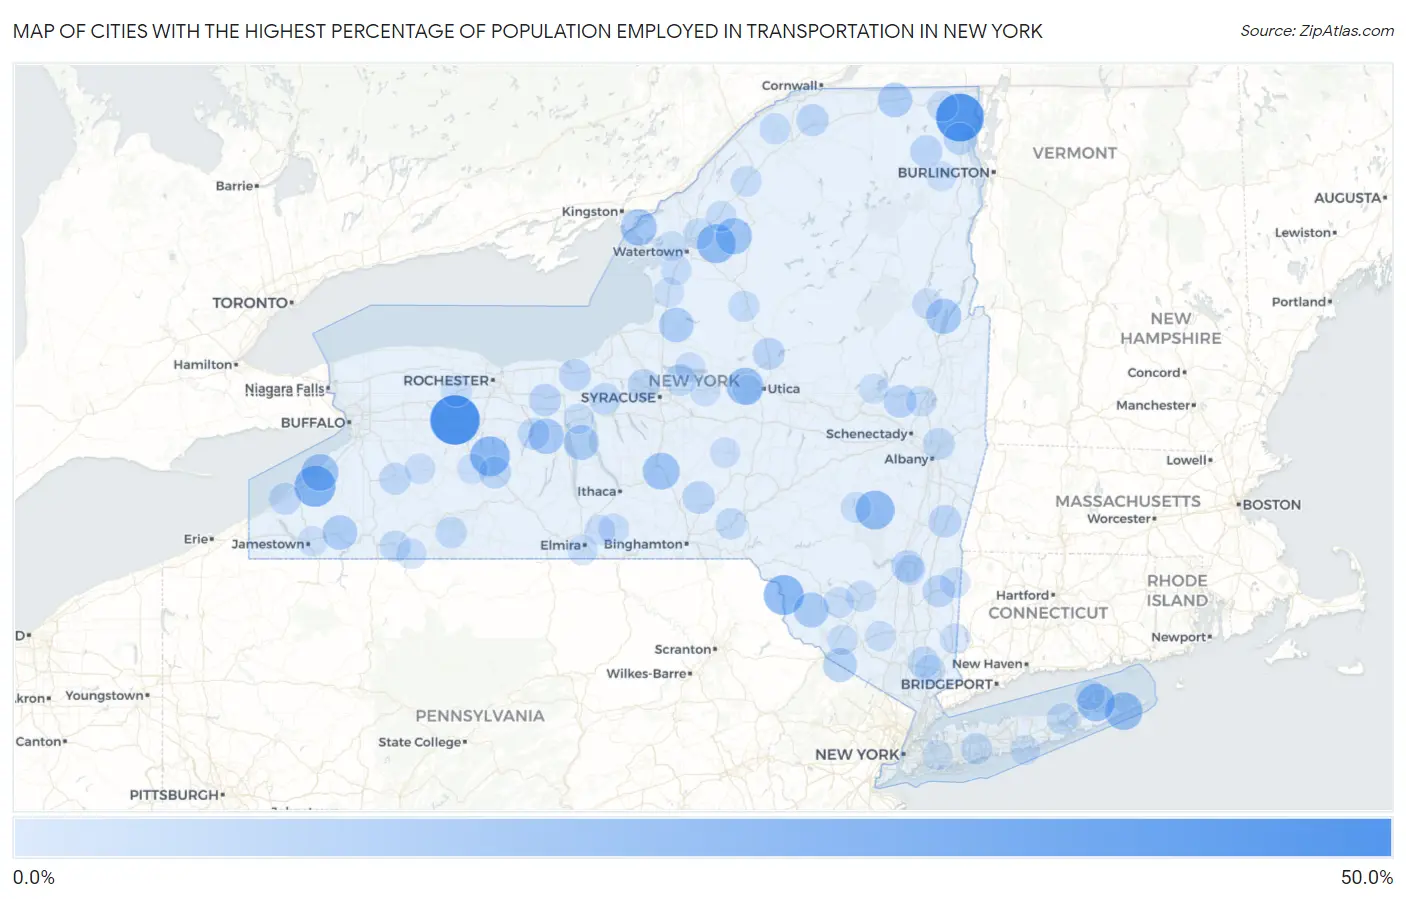
Map of Cities with the Highest Percentage of Population Employed in Transportation in New York
0.0%
50.0%
Cities with the Highest Percentage of Population Employed in Transportation in New York
| City | % Employed | vs State | vs National | |
| 1. | Linwood | 50.0% | 3.9%(+46.1)#1 | 3.8%(+46.2)#99 |
| 2. | West Chazy | 46.4% | 3.9%(+42.5)#2 | 3.8%(+42.6)#125 |
| 3. | West Kill | 38.7% | 3.9%(+34.8)#3 | 3.8%(+34.9)#185 |
| 4. | Barrytown | 34.1% | 3.9%(+30.2)#4 | 3.8%(+30.3)#258 |
| 5. | Forestville | 31.5% | 3.9%(+27.5)#5 | 3.8%(+27.6)#313 |
| 6. | Callicoon | 29.0% | 3.9%(+25.1)#6 | 3.8%(+25.2)#362 |
| 7. | Websters Crossing | 28.6% | 3.9%(+24.6)#7 | 3.8%(+24.8)#369 |
| 8. | Windham | 26.5% | 3.9%(+22.6)#8 | 3.8%(+22.7)#435 |
| 9. | Herrings | 26.3% | 3.9%(+22.4)#9 | 3.8%(+22.5)#443 |
| 10. | Napeague | 24.1% | 3.9%(+20.2)#10 | 3.8%(+20.3)#523 |
| 11. | Shelter Island | 23.9% | 3.9%(+20.0)#11 | 3.8%(+20.1)#532 |
| 12. | Westmoreland | 22.8% | 3.9%(+18.9)#12 | 3.8%(+19.0)#598 |
| 13. | Sunset Bay | 22.4% | 3.9%(+18.4)#13 | 3.8%(+18.5)#624 |
| 14. | Blodgett Mills | 22.3% | 3.9%(+18.4)#14 | 3.8%(+18.5)#627 |
| 15. | Springwater | 21.8% | 3.9%(+17.9)#15 | 3.8%(+18.0)#654 |
| 16. | Natural Bridge | 21.3% | 3.9%(+17.3)#16 | 3.8%(+17.5)#696 |
| 17. | Cape Vincent | 20.9% | 3.9%(+16.9)#17 | 3.8%(+17.0)#724 |
| 18. | Mongaup Valley | 20.7% | 3.9%(+16.8)#18 | 3.8%(+16.9)#737 |
| 19. | North Granville | 20.6% | 3.9%(+16.7)#19 | 3.8%(+16.8)#744 |
| 20. | Wells Bridge | 20.5% | 3.9%(+16.5)#20 | 3.8%(+16.6)#756 |
| 21. | East Worcester | 20.3% | 3.9%(+16.4)#21 | 3.8%(+16.5)#769 |
| 22. | Gorham | 19.4% | 3.9%(+15.5)#22 | 3.8%(+15.6)#848 |
| 23. | Bolton Landing | 18.6% | 3.9%(+14.7)#23 | 3.8%(+14.8)#917 |
| 24. | Smallwood | 18.5% | 3.9%(+14.5)#24 | 3.8%(+14.7)#937 |
| 25. | Romulus | 18.3% | 3.9%(+14.4)#25 | 3.8%(+14.5)#959 |
| 26. | Altmar | 17.7% | 3.9%(+13.8)#26 | 3.8%(+13.9)#1,037 |
| 27. | East Randolph | 17.4% | 3.9%(+13.5)#27 | 3.8%(+13.6)#1,069 |
| 28. | Chateaugay | 17.2% | 3.9%(+13.2)#28 | 3.8%(+13.4)#1,100 |
| 29. | Unionville | 16.2% | 3.9%(+12.3)#29 | 3.8%(+12.4)#1,229 |
| 30. | Westford | 15.9% | 3.9%(+12.0)#30 | 3.8%(+12.1)#1,277 |
| 31. | Galway | 13.7% | 3.9%(+9.76)#31 | 3.8%(+9.88)#1,708 |
| 32. | Philmont | 13.5% | 3.9%(+9.55)#32 | 3.8%(+9.67)#1,753 |
| 33. | Smithville Flats | 13.4% | 3.9%(+9.43)#33 | 3.8%(+9.56)#1,794 |
| 34. | East Kingston | 13.3% | 3.9%(+9.39)#34 | 3.8%(+9.52)#1,800 |
| 35. | Schuyler Lake | 13.0% | 3.9%(+9.10)#35 | 3.8%(+9.23)#1,881 |
| 36. | Plattsburgh West | 13.0% | 3.9%(+9.10)#36 | 3.8%(+9.22)#1,884 |
| 37. | Port Gibson | 12.9% | 3.9%(+8.91)#37 | 3.8%(+9.03)#1,940 |
| 38. | Winthrop | 12.8% | 3.9%(+8.86)#38 | 3.8%(+8.98)#1,955 |
| 39. | Remsen | 12.6% | 3.9%(+8.69)#39 | 3.8%(+8.81)#2,010 |
| 40. | Seneca Knolls | 12.6% | 3.9%(+8.63)#40 | 3.8%(+8.75)#2,026 |
| 41. | North Rose | 12.4% | 3.9%(+8.47)#41 | 3.8%(+8.59)#2,084 |
| 42. | Wayland | 12.4% | 3.9%(+8.46)#42 | 3.8%(+8.58)#2,087 |
| 43. | Redford | 12.3% | 3.9%(+8.39)#43 | 3.8%(+8.51)#2,109 |
| 44. | Millbrook | 12.2% | 3.9%(+8.30)#44 | 3.8%(+8.42)#2,146 |
| 45. | Wurtsboro Hills | 12.1% | 3.9%(+8.14)#45 | 3.8%(+8.26)#2,198 |
| 46. | Green Island | 12.1% | 3.9%(+8.12)#46 | 3.8%(+8.24)#2,208 |
| 47. | Brocton | 11.9% | 3.9%(+8.00)#47 | 3.8%(+8.13)#2,248 |
| 48. | Yorkshire | 11.9% | 3.9%(+7.98)#48 | 3.8%(+8.11)#2,257 |
| 49. | Crystal Beach | 11.9% | 3.9%(+7.97)#49 | 3.8%(+8.09)#2,262 |
| 50. | Shrub Oak | 11.8% | 3.9%(+7.85)#50 | 3.8%(+7.97)#2,316 |
| 51. | Port Byron | 11.6% | 3.9%(+7.70)#51 | 3.8%(+7.83)#2,365 |
| 52. | Bridgeport | 11.4% | 3.9%(+7.42)#52 | 3.8%(+7.54)#2,492 |
| 53. | Aquebogue | 11.1% | 3.9%(+7.20)#53 | 3.8%(+7.32)#2,570 |
| 54. | Wyandanch | 11.1% | 3.9%(+7.13)#54 | 3.8%(+7.25)#2,614 |
| 55. | Afton | 11.0% | 3.9%(+7.09)#55 | 3.8%(+7.21)#2,629 |
| 56. | Scio | 10.8% | 3.9%(+6.89)#56 | 3.8%(+7.02)#2,711 |
| 57. | St Bonaventure | 10.7% | 3.9%(+6.74)#57 | 3.8%(+6.86)#2,758 |
| 58. | Hurleyville | 10.6% | 3.9%(+6.65)#58 | 3.8%(+6.77)#2,806 |
| 59. | Madrid | 10.4% | 3.9%(+6.45)#59 | 3.8%(+6.57)#2,898 |
| 60. | Evans Mills | 10.3% | 3.9%(+6.34)#60 | 3.8%(+6.46)#2,975 |
| 61. | Turin | 10.2% | 3.9%(+6.27)#61 | 3.8%(+6.39)#3,013 |
| 62. | Fort Covington | 10.2% | 3.9%(+6.24)#62 | 3.8%(+6.36)#3,026 |
| 63. | Bergen | 10.1% | 3.9%(+6.12)#63 | 3.8%(+6.25)#3,080 |
| 64. | Richville | 10.0% | 3.9%(+6.06)#64 | 3.8%(+6.18)#3,108 |
| 65. | Prattsville | 10.0% | 3.9%(+6.06)#65 | 3.8%(+6.18)#3,125 |
| 66. | Napanoch | 9.9% | 3.9%(+5.99)#66 | 3.8%(+6.11)#3,170 |
| 67. | Woodridge | 9.6% | 3.9%(+5.70)#67 | 3.8%(+5.82)#3,351 |
| 68. | Altona | 9.6% | 3.9%(+5.65)#68 | 3.8%(+5.77)#3,390 |
| 69. | Antwerp | 9.5% | 3.9%(+5.61)#69 | 3.8%(+5.73)#3,418 |
| 70. | North Ballston Spa | 9.5% | 3.9%(+5.56)#70 | 3.8%(+5.68)#3,453 |
| 71. | Amenia | 9.4% | 3.9%(+5.48)#71 | 3.8%(+5.60)#3,500 |
| 72. | Van Etten | 9.4% | 3.9%(+5.46)#72 | 3.8%(+5.58)#3,508 |
| 73. | Yorktown Heights | 9.4% | 3.9%(+5.42)#73 | 3.8%(+5.55)#3,536 |
| 74. | Adams Center | 9.3% | 3.9%(+5.41)#74 | 3.8%(+5.53)#3,550 |
| 75. | Maybrook | 9.3% | 3.9%(+5.35)#75 | 3.8%(+5.47)#3,584 |
| 76. | Putnam Lake | 9.2% | 3.9%(+5.29)#76 | 3.8%(+5.41)#3,633 |
| 77. | Erin | 9.2% | 3.9%(+5.28)#77 | 3.8%(+5.41)#3,635 |
| 78. | Rhinecliff | 9.2% | 3.9%(+5.28)#78 | 3.8%(+5.40)#3,641 |
| 79. | Lake Huntington | 9.1% | 3.9%(+5.15)#79 | 3.8%(+5.27)#3,742 |
| 80. | Byersville | 9.1% | 3.9%(+5.15)#80 | 3.8%(+5.27)#3,764 |
| 81. | Portville | 9.1% | 3.9%(+5.13)#81 | 3.8%(+5.25)#3,777 |
| 82. | Chestertown | 9.0% | 3.9%(+5.09)#82 | 3.8%(+5.21)#3,801 |
| 83. | Southport | 8.9% | 3.9%(+5.00)#83 | 3.8%(+5.12)#3,874 |
| 84. | Waterloo | 8.9% | 3.9%(+4.93)#84 | 3.8%(+5.05)#3,936 |
| 85. | Bliss | 8.8% | 3.9%(+4.85)#85 | 3.8%(+4.97)#3,989 |
| 86. | Otisville | 8.8% | 3.9%(+4.84)#86 | 3.8%(+4.96)#3,998 |
| 87. | Smyrna | 8.7% | 3.9%(+4.81)#87 | 3.8%(+4.93)#4,037 |
| 88. | Cleveland | 8.7% | 3.9%(+4.80)#88 | 3.8%(+4.92)#4,045 |
| 89. | Greenport West | 8.7% | 3.9%(+4.76)#89 | 3.8%(+4.88)#4,068 |
| 90. | Dexter | 8.7% | 3.9%(+4.76)#90 | 3.8%(+4.88)#4,070 |
| 91. | South Edmeston | 8.7% | 3.9%(+4.76)#91 | 3.8%(+4.88)#4,079 |
| 92. | Canastota | 8.7% | 3.9%(+4.74)#92 | 3.8%(+4.86)#4,098 |
| 93. | Bellport | 8.7% | 3.9%(+4.71)#93 | 3.8%(+4.84)#4,122 |
| 94. | Woodbourne | 8.6% | 3.9%(+4.71)#94 | 3.8%(+4.83)#4,129 |
| 95. | Falconer | 8.6% | 3.9%(+4.68)#95 | 3.8%(+4.81)#4,140 |
| 96. | Clark Mills | 8.6% | 3.9%(+4.65)#96 | 3.8%(+4.77)#4,175 |
| 97. | Elmont | 8.5% | 3.9%(+4.61)#97 | 3.8%(+4.73)#4,214 |
| 98. | Mayfield | 8.5% | 3.9%(+4.60)#98 | 3.8%(+4.72)#4,230 |
| 99. | Au Sable Forks | 8.5% | 3.9%(+4.56)#99 | 3.8%(+4.69)#4,267 |
| 100. | Mannsville | 8.3% | 3.9%(+4.39)#100 | 3.8%(+4.52)#4,415 |
Common Questions
What are the Top 10 Cities with the Highest Percentage of Population Employed in Transportation in New York?
Top 10 Cities with the Highest Percentage of Population Employed in Transportation in New York are:
#1
50.0%
#2
46.4%
#3
31.5%
#4
29.0%
#5
28.6%
#6
26.5%
#7
26.3%
#8
24.1%
#9
23.9%
#10
22.8%
What city has the Highest Percentage of Population Employed in Transportation in New York?
Linwood has the Highest Percentage of Population Employed in Transportation in New York with 50.0%.
What is the Percentage of Population Employed in Transportation in the State of New York?
Percentage of Population Employed in Transportation in New York is 3.9%.
What is the Percentage of Population Employed in Transportation in the United States?
Percentage of Population Employed in Transportation in the United States is 3.8%.