Cities with the Highest Percentage of Population Employed in Transportation in Massachusetts
RELATED REPORTS & OPTIONS
Transportation
Massachusetts
Compare Cities
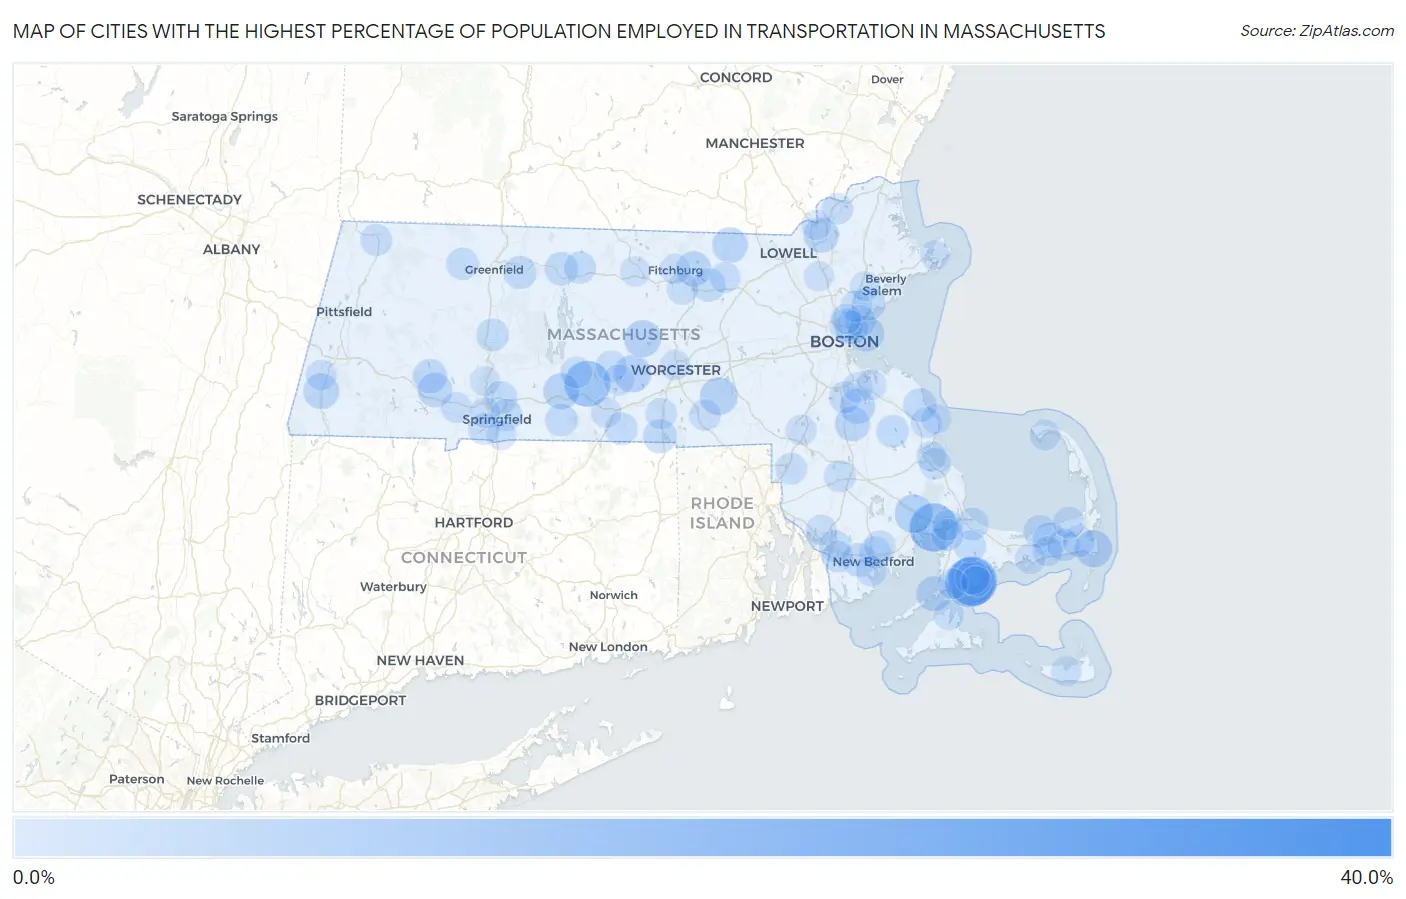
Map of Cities with the Highest Percentage of Population Employed in Transportation in Massachusetts
0.0%
40.0%
Cities with the Highest Percentage of Population Employed in Transportation in Massachusetts
| City | % Employed | vs State | vs National | |
| 1. | Green Harbor | 39.3% | 3.0%(+36.3)#1 | 3.8%(+35.5)#180 |
| 2. | Seconsett Island | 17.8% | 3.0%(+14.8)#2 | 3.8%(+14.0)#1,032 |
| 3. | Monomoscoy Island | 17.6% | 3.0%(+14.7)#3 | 3.8%(+13.8)#1,045 |
| 4. | Onset | 16.9% | 3.0%(+13.9)#4 | 3.8%(+13.1)#1,134 |
| 5. | Warren | 15.2% | 3.0%(+12.2)#5 | 3.8%(+11.3)#1,397 |
| 6. | West Warren | 13.4% | 3.0%(+10.4)#6 | 3.8%(+9.57)#1,790 |
| 7. | West Wareham | 9.7% | 3.0%(+6.69)#7 | 3.8%(+5.84)#3,341 |
| 8. | Upton | 9.0% | 3.0%(+5.99)#8 | 3.8%(+5.14)#3,858 |
| 9. | Spencer | 8.8% | 3.0%(+5.84)#9 | 3.8%(+4.99)#3,975 |
| 10. | Chatham | 8.6% | 3.0%(+5.68)#10 | 3.8%(+4.82)#4,131 |
| 11. | Rutland | 8.5% | 3.0%(+5.52)#11 | 3.8%(+4.67)#4,281 |
| 12. | Palmer Town | 7.8% | 3.0%(+4.84)#12 | 3.8%(+3.99)#4,962 |
| 13. | Great Barrington | 7.5% | 3.0%(+4.54)#13 | 3.8%(+3.69)#5,317 |
| 14. | Winthrop Town | 7.5% | 3.0%(+4.51)#14 | 3.8%(+3.66)#5,349 |
| 15. | East Pepperell | 7.3% | 3.0%(+4.38)#15 | 3.8%(+3.52)#5,513 |
| 16. | Lawrence | 7.3% | 3.0%(+4.29)#16 | 3.8%(+3.44)#5,634 |
| 17. | Holbrook | 7.1% | 3.0%(+4.10)#17 | 3.8%(+3.25)#5,893 |
| 18. | Woods Hole | 7.0% | 3.0%(+4.02)#18 | 3.8%(+3.17)#5,975 |
| 19. | Brockton | 7.0% | 3.0%(+3.99)#19 | 3.8%(+3.14)#6,021 |
| 20. | Lunenburg | 7.0% | 3.0%(+3.99)#20 | 3.8%(+3.14)#6,024 |
| 21. | Russell | 6.7% | 3.0%(+3.75)#21 | 3.8%(+2.90)#6,397 |
| 22. | South Dennis | 6.6% | 3.0%(+3.67)#22 | 3.8%(+2.82)#6,523 |
| 23. | Huntington | 6.6% | 3.0%(+3.59)#23 | 3.8%(+2.74)#6,634 |
| 24. | Seabrook | 6.3% | 3.0%(+3.32)#24 | 3.8%(+2.47)#7,098 |
| 25. | Smith Mills | 6.0% | 3.0%(+3.08)#25 | 3.8%(+2.23)#7,568 |
| 26. | Webster | 6.0% | 3.0%(+3.06)#26 | 3.8%(+2.21)#7,589 |
| 27. | Lynn | 6.0% | 3.0%(+2.99)#27 | 3.8%(+2.14)#7,736 |
| 28. | Orange | 5.9% | 3.0%(+2.94)#28 | 3.8%(+2.09)#7,840 |
| 29. | Marshfield Hills | 5.9% | 3.0%(+2.91)#29 | 3.8%(+2.06)#7,908 |
| 30. | Shirley | 5.9% | 3.0%(+2.91)#30 | 3.8%(+2.06)#7,910 |
| 31. | Chelsea | 5.6% | 3.0%(+2.64)#31 | 3.8%(+1.79)#8,489 |
| 32. | Dennis | 5.5% | 3.0%(+2.49)#32 | 3.8%(+1.64)#8,821 |
| 33. | Millers Falls | 5.4% | 3.0%(+2.44)#33 | 3.8%(+1.59)#8,947 |
| 34. | Everett | 5.4% | 3.0%(+2.40)#34 | 3.8%(+1.55)#9,056 |
| 35. | Southbridge Town | 5.3% | 3.0%(+2.37)#35 | 3.8%(+1.52)#9,105 |
| 36. | Hatfield | 5.3% | 3.0%(+2.29)#36 | 3.8%(+1.44)#9,317 |
| 37. | Hanson | 5.2% | 3.0%(+2.22)#37 | 3.8%(+1.37)#9,474 |
| 38. | Northwest Harwich | 5.1% | 3.0%(+2.17)#38 | 3.8%(+1.32)#9,590 |
| 39. | Chicopee | 5.1% | 3.0%(+2.13)#39 | 3.8%(+1.28)#9,693 |
| 40. | Shelburne Falls | 5.1% | 3.0%(+2.11)#40 | 3.8%(+1.26)#9,742 |
| 41. | Sandwich | 5.1% | 3.0%(+2.11)#41 | 3.8%(+1.26)#9,756 |
| 42. | Monson Center | 5.1% | 3.0%(+2.09)#42 | 3.8%(+1.24)#9,800 |
| 43. | Forestdale | 4.9% | 3.0%(+1.93)#43 | 3.8%(+1.08)#10,203 |
| 44. | Springfield | 4.8% | 3.0%(+1.87)#44 | 3.8%(+1.02)#10,382 |
| 45. | Monument Beach | 4.8% | 3.0%(+1.84)#45 | 3.8%(+0.985)#10,455 |
| 46. | Athol | 4.8% | 3.0%(+1.80)#46 | 3.8%(+0.950)#10,549 |
| 47. | Taunton | 4.7% | 3.0%(+1.78)#47 | 3.8%(+0.928)#10,634 |
| 48. | Fall River | 4.7% | 3.0%(+1.76)#48 | 3.8%(+0.907)#10,702 |
| 49. | North Adams | 4.7% | 3.0%(+1.71)#49 | 3.8%(+0.862)#10,811 |
| 50. | New Bedford | 4.7% | 3.0%(+1.70)#50 | 3.8%(+0.853)#10,836 |
| 51. | East Harwich | 4.6% | 3.0%(+1.63)#51 | 3.8%(+0.778)#11,052 |
| 52. | Brewster | 4.6% | 3.0%(+1.59)#52 | 3.8%(+0.742)#11,156 |
| 53. | Randolph Town | 4.6% | 3.0%(+1.59)#53 | 3.8%(+0.739)#11,171 |
| 54. | Ware | 4.5% | 3.0%(+1.56)#54 | 3.8%(+0.707)#11,274 |
| 55. | Attleboro | 4.5% | 3.0%(+1.56)#55 | 3.8%(+0.706)#11,275 |
| 56. | Revere | 4.5% | 3.0%(+1.53)#56 | 3.8%(+0.677)#11,352 |
| 57. | Acushnet Center | 4.5% | 3.0%(+1.51)#57 | 3.8%(+0.656)#11,436 |
| 58. | Agawam Town | 4.5% | 3.0%(+1.49)#58 | 3.8%(+0.640)#11,497 |
| 59. | Leominster | 4.5% | 3.0%(+1.49)#59 | 3.8%(+0.636)#11,514 |
| 60. | North Westport | 4.4% | 3.0%(+1.41)#60 | 3.8%(+0.563)#11,736 |
| 61. | Oxford | 4.4% | 3.0%(+1.40)#61 | 3.8%(+0.549)#11,792 |
| 62. | North Brookfield | 4.4% | 3.0%(+1.39)#62 | 3.8%(+0.540)#11,815 |
| 63. | Whitinsville | 4.3% | 3.0%(+1.37)#63 | 3.8%(+0.523)#11,879 |
| 64. | Saugus | 4.3% | 3.0%(+1.34)#64 | 3.8%(+0.493)#11,982 |
| 65. | Plymouth | 4.3% | 3.0%(+1.33)#65 | 3.8%(+0.478)#12,029 |
| 66. | Haverhill | 4.2% | 3.0%(+1.22)#66 | 3.8%(+0.372)#12,377 |
| 67. | Marshfield | 4.2% | 3.0%(+1.18)#67 | 3.8%(+0.334)#12,500 |
| 68. | East Brookfield | 4.1% | 3.0%(+1.09)#68 | 3.8%(+0.237)#12,835 |
| 69. | Provincetown | 4.0% | 3.0%(+1.00)#69 | 3.8%(+0.152)#13,095 |
| 70. | Westfield | 3.9% | 3.0%(+0.975)#70 | 3.8%(+0.125)#13,188 |
| 71. | West Springfield Town | 3.9% | 3.0%(+0.929)#71 | 3.8%(+0.078)#13,346 |
| 72. | West Yarmouth | 3.9% | 3.0%(+0.911)#72 | 3.8%(+0.060)#13,405 |
| 73. | Bliss Corner | 3.9% | 3.0%(+0.900)#73 | 3.8%(+0.049)#13,434 |
| 74. | Buzzards Bay | 3.8% | 3.0%(+0.861)#74 | 3.8%(+0.011)#13,597 |
| 75. | Ayer | 3.8% | 3.0%(+0.840)#75 | 3.8%(-0.010)#13,667 |
| 76. | North Attleborough | 3.8% | 3.0%(+0.812)#76 | 3.8%(-0.038)#13,741 |
| 77. | Worcester | 3.8% | 3.0%(+0.804)#77 | 3.8%(-0.046)#13,784 |
| 78. | Foxborough | 3.8% | 3.0%(+0.803)#78 | 3.8%(-0.048)#13,789 |
| 79. | Somerset | 3.8% | 3.0%(+0.792)#79 | 3.8%(-0.058)#13,825 |
| 80. | Housatonic | 3.7% | 3.0%(+0.727)#80 | 3.8%(-0.123)#14,084 |
| 81. | Teaticket | 3.6% | 3.0%(+0.660)#81 | 3.8%(-0.191)#14,299 |
| 82. | Fiskdale | 3.6% | 3.0%(+0.635)#82 | 3.8%(-0.215)#14,385 |
| 83. | Gardner | 3.6% | 3.0%(+0.591)#83 | 3.8%(-0.259)#14,534 |
| 84. | North Plymouth | 3.5% | 3.0%(+0.517)#84 | 3.8%(-0.333)#14,804 |
| 85. | West Dennis | 3.5% | 3.0%(+0.515)#85 | 3.8%(-0.336)#14,820 |
| 86. | Fitchburg | 3.5% | 3.0%(+0.495)#86 | 3.8%(-0.356)#14,880 |
| 87. | Nantucket | 3.5% | 3.0%(+0.494)#87 | 3.8%(-0.356)#14,884 |
| 88. | Braintree Town | 3.4% | 3.0%(+0.472)#88 | 3.8%(-0.379)#14,970 |
| 89. | New Seabury | 3.4% | 3.0%(+0.467)#89 | 3.8%(-0.384)#14,990 |
| 90. | Vineyard Haven | 3.4% | 3.0%(+0.452)#90 | 3.8%(-0.398)#15,048 |
| 91. | Weymouth Town | 3.4% | 3.0%(+0.442)#91 | 3.8%(-0.409)#15,094 |
| 92. | Holyoke | 3.4% | 3.0%(+0.419)#92 | 3.8%(-0.432)#15,179 |
| 93. | Malden | 3.4% | 3.0%(+0.412)#93 | 3.8%(-0.438)#15,205 |
| 94. | Ocean Bluff Brant Rock | 3.4% | 3.0%(+0.392)#94 | 3.8%(-0.459)#15,275 |
| 95. | Methuen Town | 3.3% | 3.0%(+0.379)#95 | 3.8%(-0.472)#15,322 |
| 96. | Longmeadow | 3.3% | 3.0%(+0.362)#96 | 3.8%(-0.489)#15,414 |
| 97. | Peabody | 3.3% | 3.0%(+0.339)#97 | 3.8%(-0.511)#15,481 |
| 98. | Greenfield | 3.3% | 3.0%(+0.330)#98 | 3.8%(-0.521)#15,521 |
| 99. | Wilmington | 3.3% | 3.0%(+0.306)#99 | 3.8%(-0.544)#15,598 |
| 100. | Gloucester | 3.3% | 3.0%(+0.298)#100 | 3.8%(-0.553)#15,624 |
Common Questions
What are the Top 10 Cities with the Highest Percentage of Population Employed in Transportation in Massachusetts?
Top 10 Cities with the Highest Percentage of Population Employed in Transportation in Massachusetts are:
#1
17.8%
#2
17.6%
#3
16.9%
#4
15.2%
#5
9.7%
#6
9.0%
#7
8.8%
#8
8.6%
#9
8.5%
#10
7.8%
What city has the Highest Percentage of Population Employed in Transportation in Massachusetts?
Seconsett Island has the Highest Percentage of Population Employed in Transportation in Massachusetts with 17.8%.
What is the Percentage of Population Employed in Transportation in the State of Massachusetts?
Percentage of Population Employed in Transportation in Massachusetts is 3.0%.
What is the Percentage of Population Employed in Transportation in the United States?
Percentage of Population Employed in Transportation in the United States is 3.8%.