Cities with the Highest Percentage of Population Employed in Transportation in Idaho
RELATED REPORTS & OPTIONS
Transportation
Idaho
Compare Cities
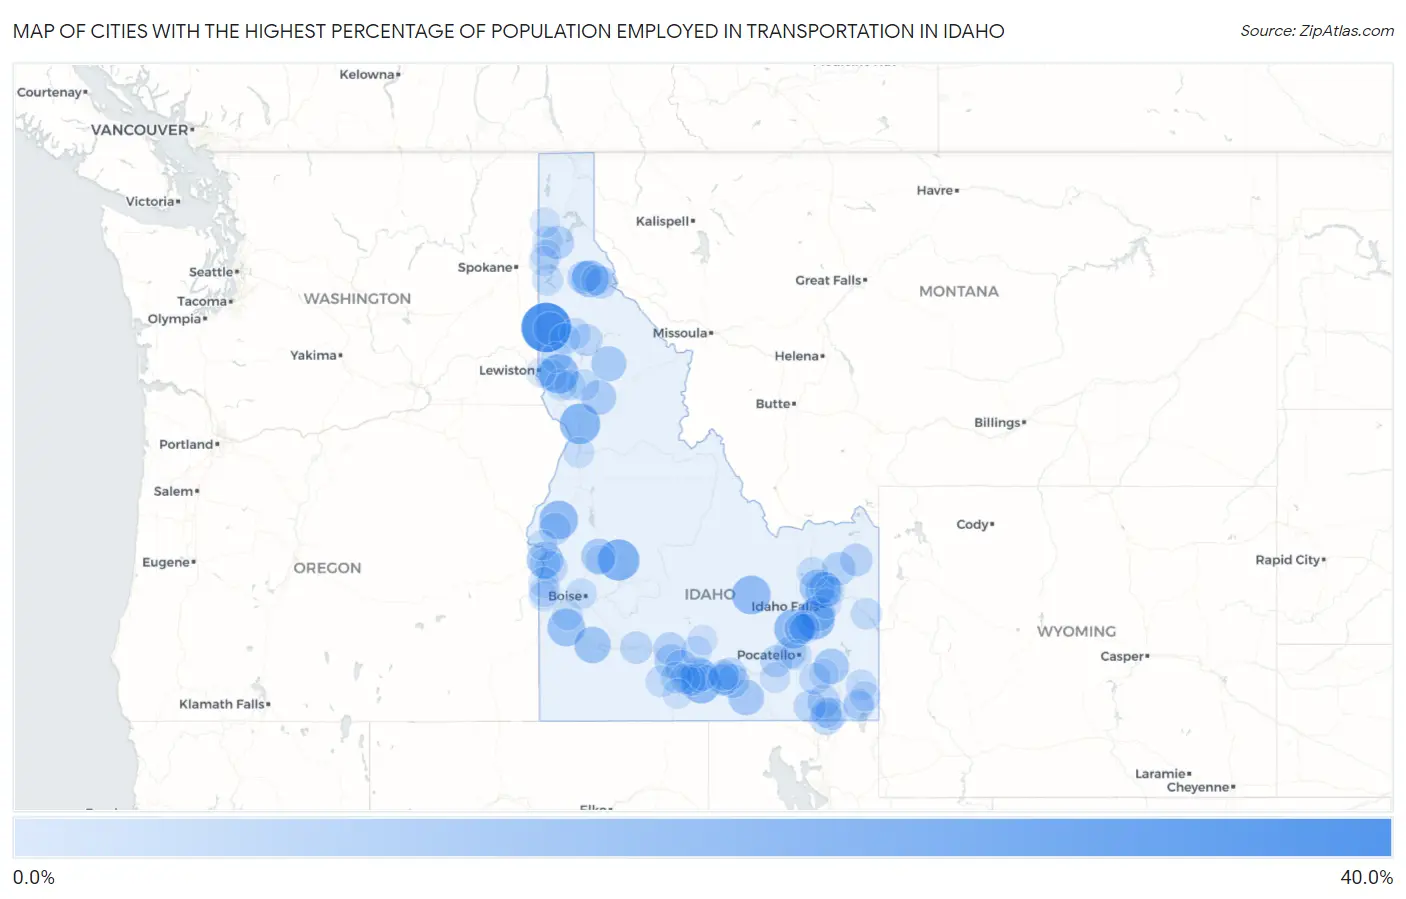
Map of Cities with the Highest Percentage of Population Employed in Transportation in Idaho
0.0%
40.0%
Cities with the Highest Percentage of Population Employed in Transportation in Idaho
| City | % Employed | vs State | vs National | |
| 1. | Onaway | 34.5% | 3.9%(+30.6)#1 | 3.8%(+30.7)#249 |
| 2. | Lowman | 21.4% | 3.9%(+17.5)#2 | 3.8%(+17.6)#687 |
| 3. | White Bird | 20.0% | 3.9%(+16.1)#3 | 3.8%(+16.2)#802 |
| 4. | Culdesac | 18.5% | 3.9%(+14.6)#4 | 3.8%(+14.7)#925 |
| 5. | Murtaugh | 18.1% | 3.9%(+14.2)#5 | 3.8%(+14.3)#991 |
| 6. | Rockford | 18.0% | 3.9%(+14.1)#6 | 3.8%(+14.2)#999 |
| 7. | Firth | 17.9% | 3.9%(+14.0)#7 | 3.8%(+14.1)#1,014 |
| 8. | Arco | 17.4% | 3.9%(+13.5)#8 | 3.8%(+13.6)#1,073 |
| 9. | Cambridge | 17.1% | 3.9%(+13.2)#9 | 3.8%(+13.3)#1,103 |
| 10. | Murphy | 15.5% | 3.9%(+11.6)#10 | 3.8%(+11.7)#1,333 |
| 11. | Laclede | 15.4% | 3.9%(+11.5)#11 | 3.8%(+11.6)#1,349 |
| 12. | Wardner | 14.8% | 3.9%(+10.9)#12 | 3.8%(+11.0)#1,482 |
| 13. | Payette | 13.8% | 3.9%(+9.91)#13 | 3.8%(+9.99)#1,681 |
| 14. | Grand View | 13.7% | 3.9%(+9.81)#14 | 3.8%(+9.89)#1,705 |
| 15. | Lewisville | 13.4% | 3.9%(+9.55)#15 | 3.8%(+9.62)#1,771 |
| 16. | Roberts | 12.7% | 3.9%(+8.85)#16 | 3.8%(+8.93)#1,973 |
| 17. | Malta | 12.5% | 3.9%(+8.61)#17 | 3.8%(+8.68)#2,039 |
| 18. | Shelley | 12.4% | 3.9%(+8.49)#18 | 3.8%(+8.56)#2,091 |
| 19. | Bancroft | 12.0% | 3.9%(+8.11)#19 | 3.8%(+8.18)#2,228 |
| 20. | Pierce | 11.9% | 3.9%(+8.03)#20 | 3.8%(+8.10)#2,258 |
| 21. | Eden | 11.8% | 3.9%(+7.92)#21 | 3.8%(+7.99)#2,305 |
| 22. | Letha | 11.8% | 3.9%(+7.91)#22 | 3.8%(+7.99)#2,307 |
| 23. | Crouch | 11.7% | 3.9%(+7.82)#23 | 3.8%(+7.89)#2,347 |
| 24. | Stites | 11.5% | 3.9%(+7.64)#24 | 3.8%(+7.72)#2,413 |
| 25. | Hammett | 9.8% | 3.9%(+5.89)#25 | 3.8%(+5.97)#3,253 |
| 26. | Declo | 9.7% | 3.9%(+5.85)#26 | 3.8%(+5.93)#3,281 |
| 27. | Parker | 9.6% | 3.9%(+5.73)#27 | 3.8%(+5.80)#3,362 |
| 28. | Wendell | 9.6% | 3.9%(+5.70)#28 | 3.8%(+5.78)#3,389 |
| 29. | Princeton | 9.0% | 3.9%(+5.12)#29 | 3.8%(+5.19)#3,824 |
| 30. | Athol | 8.9% | 3.9%(+5.05)#30 | 3.8%(+5.12)#3,875 |
| 31. | Gooding | 8.9% | 3.9%(+4.99)#31 | 3.8%(+5.06)#3,927 |
| 32. | Jerome | 8.6% | 3.9%(+4.71)#32 | 3.8%(+4.79)#4,160 |
| 33. | Pinehurst | 8.5% | 3.9%(+4.59)#33 | 3.8%(+4.67)#4,278 |
| 34. | Heyburn | 8.5% | 3.9%(+4.57)#34 | 3.8%(+4.64)#4,299 |
| 35. | Weston | 8.5% | 3.9%(+4.56)#35 | 3.8%(+4.64)#4,302 |
| 36. | Oxford | 8.3% | 3.9%(+4.44)#36 | 3.8%(+4.52)#4,447 |
| 37. | Ashton | 8.2% | 3.9%(+4.34)#37 | 3.8%(+4.41)#4,545 |
| 38. | New Plymouth | 7.9% | 3.9%(+4.04)#38 | 3.8%(+4.12)#4,823 |
| 39. | Arbon Valley | 7.9% | 3.9%(+3.99)#39 | 3.8%(+4.07)#4,866 |
| 40. | Preston | 7.9% | 3.9%(+3.98)#40 | 3.8%(+4.06)#4,875 |
| 41. | Glenns Ferry | 7.9% | 3.9%(+3.97)#41 | 3.8%(+4.05)#4,886 |
| 42. | Rupert | 7.9% | 3.9%(+3.97)#42 | 3.8%(+4.05)#4,891 |
| 43. | Malad City | 7.8% | 3.9%(+3.92)#43 | 3.8%(+3.99)#4,958 |
| 44. | Elk River | 7.7% | 3.9%(+3.80)#44 | 3.8%(+3.88)#5,096 |
| 45. | Wallace | 7.7% | 3.9%(+3.78)#45 | 3.8%(+3.86)#5,128 |
| 46. | Midvale | 7.4% | 3.9%(+3.51)#46 | 3.8%(+3.59)#5,430 |
| 47. | American Falls | 7.3% | 3.9%(+3.43)#47 | 3.8%(+3.50)#5,541 |
| 48. | Hansen | 7.0% | 3.9%(+3.10)#48 | 3.8%(+3.18)#5,957 |
| 49. | Sweetwater | 6.9% | 3.9%(+3.00)#49 | 3.8%(+3.08)#6,125 |
| 50. | Arimo | 6.8% | 3.9%(+2.86)#50 | 3.8%(+2.94)#6,326 |
| 51. | Moreland | 6.6% | 3.9%(+2.72)#51 | 3.8%(+2.80)#6,560 |
| 52. | Hazelton | 6.6% | 3.9%(+2.69)#52 | 3.8%(+2.76)#6,614 |
| 53. | Kimberly | 6.5% | 3.9%(+2.62)#53 | 3.8%(+2.70)#6,710 |
| 54. | Castleford | 6.4% | 3.9%(+2.52)#54 | 3.8%(+2.59)#6,863 |
| 55. | Filer | 6.4% | 3.9%(+2.50)#55 | 3.8%(+2.58)#6,888 |
| 56. | Irwin | 6.3% | 3.9%(+2.46)#56 | 3.8%(+2.53)#6,981 |
| 57. | Bovill | 6.3% | 3.9%(+2.46)#57 | 3.8%(+2.53)#6,982 |
| 58. | Nezperce | 6.3% | 3.9%(+2.44)#58 | 3.8%(+2.51)#7,018 |
| 59. | Menan | 6.3% | 3.9%(+2.42)#59 | 3.8%(+2.50)#7,053 |
| 60. | Winchester | 6.1% | 3.9%(+2.23)#60 | 3.8%(+2.31)#7,401 |
| 61. | Burley | 6.1% | 3.9%(+2.20)#61 | 3.8%(+2.28)#7,435 |
| 62. | Paul | 6.1% | 3.9%(+2.16)#62 | 3.8%(+2.23)#7,541 |
| 63. | Wilder | 6.0% | 3.9%(+2.13)#63 | 3.8%(+2.20)#7,613 |
| 64. | Rockford Bay | 5.9% | 3.9%(+1.99)#64 | 3.8%(+2.07)#7,879 |
| 65. | Hamer | 5.9% | 3.9%(+1.99)#65 | 3.8%(+2.07)#7,905 |
| 66. | Georgetown | 5.8% | 3.9%(+1.94)#66 | 3.8%(+2.01)#7,982 |
| 67. | Juliaetta | 5.8% | 3.9%(+1.88)#67 | 3.8%(+1.96)#8,081 |
| 68. | Deary | 5.8% | 3.9%(+1.88)#68 | 3.8%(+1.96)#8,082 |
| 69. | Smelterville | 5.7% | 3.9%(+1.81)#69 | 3.8%(+1.88)#8,252 |
| 70. | Riverside | 5.7% | 3.9%(+1.78)#70 | 3.8%(+1.85)#8,332 |
| 71. | Garden City | 5.7% | 3.9%(+1.76)#71 | 3.8%(+1.84)#8,384 |
| 72. | Fruitland | 5.6% | 3.9%(+1.75)#72 | 3.8%(+1.83)#8,410 |
| 73. | Bloomington | 5.6% | 3.9%(+1.66)#73 | 3.8%(+1.74)#8,616 |
| 74. | Dayton | 5.5% | 3.9%(+1.61)#74 | 3.8%(+1.69)#8,723 |
| 75. | Dietrich | 5.5% | 3.9%(+1.57)#75 | 3.8%(+1.65)#8,801 |
| 76. | Parma | 5.4% | 3.9%(+1.55)#76 | 3.8%(+1.63)#8,852 |
| 77. | Melba | 5.4% | 3.9%(+1.55)#77 | 3.8%(+1.62)#8,864 |
| 78. | Osburn | 5.4% | 3.9%(+1.54)#78 | 3.8%(+1.62)#8,874 |
| 79. | Riggins | 5.3% | 3.9%(+1.44)#79 | 3.8%(+1.52)#9,127 |
| 80. | Craigmont | 5.3% | 3.9%(+1.42)#80 | 3.8%(+1.49)#9,164 |
| 81. | Groveland | 5.3% | 3.9%(+1.41)#81 | 3.8%(+1.48)#9,189 |
| 82. | Rockland | 5.3% | 3.9%(+1.37)#82 | 3.8%(+1.45)#9,291 |
| 83. | Pocatello | 5.2% | 3.9%(+1.29)#83 | 3.8%(+1.37)#9,492 |
| 84. | Weiser | 5.2% | 3.9%(+1.26)#84 | 3.8%(+1.34)#9,538 |
| 85. | Spirit Lake | 5.1% | 3.9%(+1.25)#85 | 3.8%(+1.32)#9,579 |
| 86. | Twin Falls | 5.1% | 3.9%(+1.19)#86 | 3.8%(+1.27)#9,724 |
| 87. | Rathdrum | 5.1% | 3.9%(+1.16)#87 | 3.8%(+1.24)#9,816 |
| 88. | Paris | 5.0% | 3.9%(+1.11)#88 | 3.8%(+1.18)#9,935 |
| 89. | Homedale | 4.9% | 3.9%(+1.04)#89 | 3.8%(+1.12)#10,113 |
| 90. | Montpelier | 4.9% | 3.9%(+1.01)#90 | 3.8%(+1.08)#10,188 |
| 91. | Blackfoot | 4.6% | 3.9%(+0.683)#91 | 3.8%(+0.760)#11,116 |
| 92. | Lincoln | 4.6% | 3.9%(+0.662)#92 | 3.8%(+0.739)#11,165 |
| 93. | Post Falls | 4.5% | 3.9%(+0.643)#93 | 3.8%(+0.720)#11,236 |
| 94. | Garden Valley | 4.5% | 3.9%(+0.567)#94 | 3.8%(+0.644)#11,482 |
| 95. | Priest River | 4.4% | 3.9%(+0.514)#95 | 3.8%(+0.591)#11,653 |
| 96. | Richfield | 4.4% | 3.9%(+0.511)#96 | 3.8%(+0.588)#11,666 |
| 97. | Rigby | 4.4% | 3.9%(+0.473)#97 | 3.8%(+0.550)#11,783 |
| 98. | Hollister | 4.3% | 3.9%(+0.454)#98 | 3.8%(+0.531)#11,841 |
| 99. | Lava Hot Springs | 4.3% | 3.9%(+0.454)#99 | 3.8%(+0.531)#11,847 |
| 100. | Lewiston | 4.3% | 3.9%(+0.428)#100 | 3.8%(+0.505)#11,938 |
Common Questions
What are the Top 10 Cities with the Highest Percentage of Population Employed in Transportation in Idaho?
Top 10 Cities with the Highest Percentage of Population Employed in Transportation in Idaho are:
What city has the Highest Percentage of Population Employed in Transportation in Idaho?
Onaway has the Highest Percentage of Population Employed in Transportation in Idaho with 34.5%.
What is the Percentage of Population Employed in Transportation in the State of Idaho?
Percentage of Population Employed in Transportation in Idaho is 3.9%.
What is the Percentage of Population Employed in Transportation in the United States?
Percentage of Population Employed in Transportation in the United States is 3.8%.