Cities with the Highest Percentage of Population Employed in Transportation in Kentucky
RELATED REPORTS & OPTIONS
Transportation
Kentucky
Compare Cities
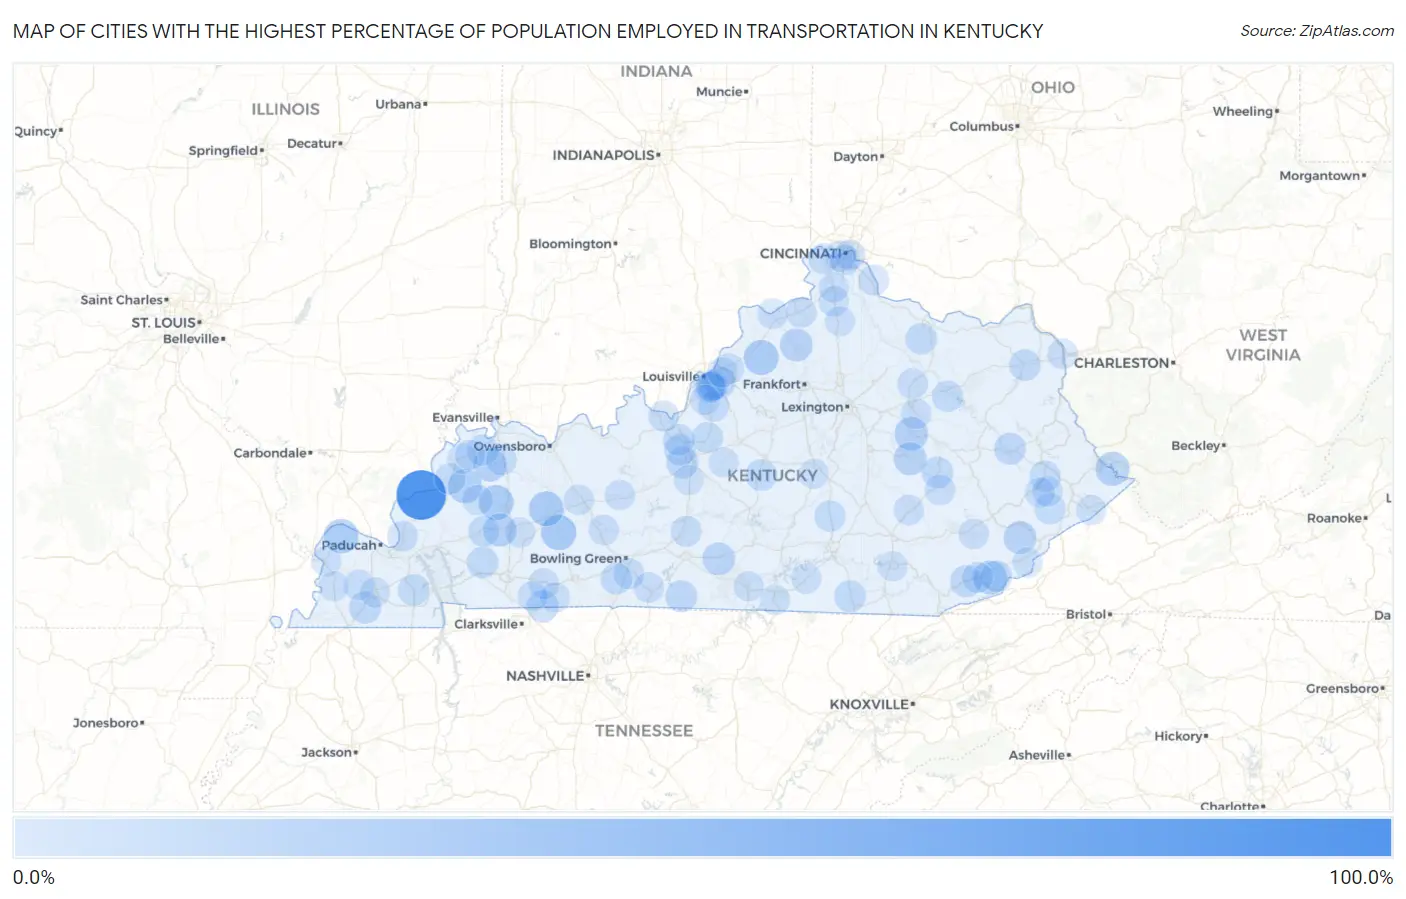
Map of Cities with the Highest Percentage of Population Employed in Transportation in Kentucky
0.0%
100.0%
Cities with the Highest Percentage of Population Employed in Transportation in Kentucky
| City | % Employed | vs State | vs National | |
| 1. | Tolu | 100.0% | 4.1%(+95.9)#1 | 3.8%(+96.2)#22 |
| 2. | Curdsville | 38.1% | 4.1%(+34.0)#2 | 3.8%(+34.3)#189 |
| 3. | Beechmont | 29.2% | 4.1%(+25.1)#3 | 3.8%(+25.4)#354 |
| 4. | Smithfield | 28.0% | 4.1%(+23.9)#4 | 3.8%(+24.1)#393 |
| 5. | Manitou | 27.9% | 4.1%(+23.8)#5 | 3.8%(+24.1)#394 |
| 6. | South Carrollton | 27.8% | 4.1%(+23.7)#6 | 3.8%(+24.0)#398 |
| 7. | Bandana | 25.9% | 4.1%(+21.8)#7 | 3.8%(+22.1)#460 |
| 8. | Wheatcroft | 24.1% | 4.1%(+20.0)#8 | 3.8%(+20.3)#520 |
| 9. | Mccarr | 24.1% | 4.1%(+20.0)#9 | 3.8%(+20.2)#525 |
| 10. | Ages | 23.9% | 4.1%(+19.8)#10 | 3.8%(+20.1)#534 |
| 11. | Thruston | 22.2% | 4.1%(+18.1)#11 | 3.8%(+18.3)#639 |
| 12. | Clay City | 22.1% | 4.1%(+18.0)#12 | 3.8%(+18.3)#642 |
| 13. | Poole | 21.1% | 4.1%(+17.0)#13 | 3.8%(+17.2)#710 |
| 14. | St Charles | 20.6% | 4.1%(+16.5)#14 | 3.8%(+16.8)#747 |
| 15. | Ravenna | 19.2% | 4.1%(+15.1)#15 | 3.8%(+15.4)#861 |
| 16. | Gratz | 18.8% | 4.1%(+14.7)#16 | 3.8%(+14.9)#900 |
| 17. | Blackey | 18.2% | 4.1%(+14.1)#17 | 3.8%(+14.4)#978 |
| 18. | Edmonton | 17.4% | 4.1%(+13.4)#18 | 3.8%(+13.6)#1,068 |
| 19. | Coldiron | 14.9% | 4.1%(+10.8)#19 | 3.8%(+11.0)#1,461 |
| 20. | Wingo | 14.8% | 4.1%(+10.7)#20 | 3.8%(+11.0)#1,480 |
| 21. | Cecilia | 14.5% | 4.1%(+10.4)#21 | 3.8%(+10.7)#1,544 |
| 22. | Fountain Run | 14.4% | 4.1%(+10.3)#22 | 3.8%(+10.6)#1,556 |
| 23. | Guthrie | 14.3% | 4.1%(+10.2)#23 | 3.8%(+10.5)#1,561 |
| 24. | Salyersville | 14.0% | 4.1%(+9.95)#24 | 3.8%(+10.2)#1,633 |
| 25. | Lebanon | 13.3% | 4.1%(+9.25)#25 | 3.8%(+9.52)#1,797 |
| 26. | Houston Acres | 13.2% | 4.1%(+9.08)#26 | 3.8%(+9.36)#1,844 |
| 27. | Whitley City | 13.0% | 4.1%(+8.94)#27 | 3.8%(+9.21)#1,885 |
| 28. | Hardin | 12.9% | 4.1%(+8.83)#28 | 3.8%(+9.10)#1,912 |
| 29. | Cerulean | 12.6% | 4.1%(+8.47)#29 | 3.8%(+8.75)#2,028 |
| 30. | Grayson | 12.5% | 4.1%(+8.42)#30 | 3.8%(+8.69)#2,036 |
| 31. | Mays Lick | 12.5% | 4.1%(+8.41)#31 | 3.8%(+8.68)#2,050 |
| 32. | Rineyville | 12.4% | 4.1%(+8.36)#32 | 3.8%(+8.63)#2,073 |
| 33. | Beattyville | 12.4% | 4.1%(+8.28)#33 | 3.8%(+8.55)#2,095 |
| 34. | Evarts | 12.0% | 4.1%(+7.93)#34 | 3.8%(+8.20)#2,225 |
| 35. | Woodburn | 11.9% | 4.1%(+7.84)#35 | 3.8%(+8.11)#2,255 |
| 36. | Vine Grove | 11.8% | 4.1%(+7.75)#36 | 3.8%(+8.03)#2,290 |
| 37. | Corydon | 11.7% | 4.1%(+7.59)#37 | 3.8%(+7.86)#2,358 |
| 38. | Salt Lick | 11.5% | 4.1%(+7.37)#38 | 3.8%(+7.64)#2,448 |
| 39. | Eubank | 11.3% | 4.1%(+7.22)#39 | 3.8%(+7.49)#2,511 |
| 40. | Lebanon Junction | 11.0% | 4.1%(+6.94)#40 | 3.8%(+7.21)#2,630 |
| 41. | Sturgis | 11.0% | 4.1%(+6.88)#41 | 3.8%(+7.15)#2,652 |
| 42. | Martin | 10.9% | 4.1%(+6.76)#42 | 3.8%(+7.04)#2,707 |
| 43. | Dawson Springs | 10.7% | 4.1%(+6.57)#43 | 3.8%(+6.85)#2,769 |
| 44. | Wheelwright | 10.5% | 4.1%(+6.41)#44 | 3.8%(+6.68)#2,848 |
| 45. | Bromley | 10.1% | 4.1%(+6.02)#45 | 3.8%(+6.30)#3,050 |
| 46. | Sharpsburg | 9.9% | 4.1%(+5.84)#46 | 3.8%(+6.12)#3,168 |
| 47. | Plano | 9.7% | 4.1%(+5.63)#47 | 3.8%(+5.91)#3,300 |
| 48. | Smithland | 9.6% | 4.1%(+5.48)#48 | 3.8%(+5.75)#3,410 |
| 49. | Horse Cave | 9.4% | 4.1%(+5.34)#49 | 3.8%(+5.61)#3,494 |
| 50. | Lynnview | 9.3% | 4.1%(+5.26)#50 | 3.8%(+5.53)#3,549 |
| 51. | Hebron Estates | 9.2% | 4.1%(+5.07)#51 | 3.8%(+5.35)#3,686 |
| 52. | Doe Valley | 9.1% | 4.1%(+5.05)#52 | 3.8%(+5.32)#3,704 |
| 53. | Elkton | 9.1% | 4.1%(+5.01)#53 | 3.8%(+5.29)#3,720 |
| 54. | Loyall | 9.1% | 4.1%(+5.00)#54 | 3.8%(+5.27)#3,731 |
| 55. | Robards | 8.9% | 4.1%(+4.86)#55 | 3.8%(+5.13)#3,868 |
| 56. | Sparta | 8.8% | 4.1%(+4.68)#56 | 3.8%(+4.95)#4,005 |
| 57. | Hebron | 8.7% | 4.1%(+4.66)#57 | 3.8%(+4.93)#4,041 |
| 58. | Fancy Farm | 8.5% | 4.1%(+4.46)#58 | 3.8%(+4.73)#4,216 |
| 59. | Fincastle | 8.5% | 4.1%(+4.43)#59 | 3.8%(+4.70)#4,251 |
| 60. | Annville | 8.5% | 4.1%(+4.40)#60 | 3.8%(+4.67)#4,274 |
| 61. | Booneville | 8.4% | 4.1%(+4.34)#61 | 3.8%(+4.62)#4,326 |
| 62. | Woodbury | 8.3% | 4.1%(+4.24)#62 | 3.8%(+4.52)#4,442 |
| 63. | Woodlawn | 8.3% | 4.1%(+4.17)#63 | 3.8%(+4.44)#4,524 |
| 64. | Carrollton | 8.1% | 4.1%(+4.05)#64 | 3.8%(+4.32)#4,637 |
| 65. | Scottsville | 8.1% | 4.1%(+4.04)#65 | 3.8%(+4.31)#4,642 |
| 66. | Kenton Vale | 7.9% | 4.1%(+3.81)#66 | 3.8%(+4.08)#4,861 |
| 67. | California | 7.9% | 4.1%(+3.81)#67 | 3.8%(+4.08)#4,863 |
| 68. | Catlettsburg | 7.9% | 4.1%(+3.76)#68 | 3.8%(+4.04)#4,899 |
| 69. | Poplar Hills | 7.8% | 4.1%(+3.74)#69 | 3.8%(+4.01)#4,928 |
| 70. | West Buechel | 7.7% | 4.1%(+3.65)#70 | 3.8%(+3.92)#5,030 |
| 71. | Camargo | 7.7% | 4.1%(+3.60)#71 | 3.8%(+3.88)#5,071 |
| 72. | Mcdowell | 7.7% | 4.1%(+3.60)#72 | 3.8%(+3.88)#5,079 |
| 73. | Watterson Park | 7.7% | 4.1%(+3.56)#73 | 3.8%(+3.83)#5,150 |
| 74. | Hyden | 7.6% | 4.1%(+3.54)#74 | 3.8%(+3.81)#5,173 |
| 75. | Providence | 7.6% | 4.1%(+3.53)#75 | 3.8%(+3.80)#5,188 |
| 76. | Beaver Dam | 7.4% | 4.1%(+3.33)#76 | 3.8%(+3.61)#5,406 |
| 77. | Caneyville | 7.4% | 4.1%(+3.31)#77 | 3.8%(+3.58)#5,452 |
| 78. | Crittenden | 7.4% | 4.1%(+3.27)#78 | 3.8%(+3.55)#5,494 |
| 79. | Walton | 7.2% | 4.1%(+3.11)#79 | 3.8%(+3.38)#5,708 |
| 80. | Monticello | 7.1% | 4.1%(+2.99)#80 | 3.8%(+3.26)#5,872 |
| 81. | Morganfield | 7.0% | 4.1%(+2.92)#81 | 3.8%(+3.19)#5,947 |
| 82. | Hollyvilla | 6.9% | 4.1%(+2.86)#82 | 3.8%(+3.13)#6,030 |
| 83. | Trenton | 6.9% | 4.1%(+2.83)#83 | 3.8%(+3.10)#6,083 |
| 84. | Mayfield | 6.9% | 4.1%(+2.82)#84 | 3.8%(+3.10)#6,090 |
| 85. | White Plains | 6.9% | 4.1%(+2.80)#85 | 3.8%(+3.07)#6,138 |
| 86. | Allensville | 6.8% | 4.1%(+2.76)#86 | 3.8%(+3.03)#6,190 |
| 87. | Waverly | 6.8% | 4.1%(+2.71)#87 | 3.8%(+2.99)#6,263 |
| 88. | Corbin | 6.8% | 4.1%(+2.67)#88 | 3.8%(+2.94)#6,323 |
| 89. | Wickliffe | 6.7% | 4.1%(+2.58)#89 | 3.8%(+2.85)#6,457 |
| 90. | Elkhorn City | 6.6% | 4.1%(+2.54)#90 | 3.8%(+2.81)#6,542 |
| 91. | Williamstown | 6.6% | 4.1%(+2.52)#91 | 3.8%(+2.79)#6,574 |
| 92. | Junction City | 6.6% | 4.1%(+2.48)#92 | 3.8%(+2.75)#6,631 |
| 93. | Plantation | 6.5% | 4.1%(+2.43)#93 | 3.8%(+2.70)#6,693 |
| 94. | Arlington | 6.5% | 4.1%(+2.43)#94 | 3.8%(+2.70)#6,696 |
| 95. | Wayland | 6.5% | 4.1%(+2.39)#95 | 3.8%(+2.66)#6,754 |
| 96. | Albany | 6.5% | 4.1%(+2.39)#96 | 3.8%(+2.66)#6,765 |
| 97. | Lynch | 6.5% | 4.1%(+2.36)#97 | 3.8%(+2.63)#6,797 |
| 98. | Sonora | 6.4% | 4.1%(+2.32)#98 | 3.8%(+2.59)#6,860 |
| 99. | New Haven | 6.4% | 4.1%(+2.27)#99 | 3.8%(+2.54)#6,955 |
| 100. | Burkesville | 6.3% | 4.1%(+2.24)#100 | 3.8%(+2.51)#7,026 |
Common Questions
What are the Top 10 Cities with the Highest Percentage of Population Employed in Transportation in Kentucky?
Top 10 Cities with the Highest Percentage of Population Employed in Transportation in Kentucky are:
#1
100.0%
#2
29.2%
#3
28.0%
#4
27.9%
#5
27.8%
#6
25.9%
#7
24.1%
#8
24.1%
#9
23.9%
#10
22.1%
What city has the Highest Percentage of Population Employed in Transportation in Kentucky?
Tolu has the Highest Percentage of Population Employed in Transportation in Kentucky with 100.0%.
What is the Percentage of Population Employed in Transportation in the State of Kentucky?
Percentage of Population Employed in Transportation in Kentucky is 4.1%.
What is the Percentage of Population Employed in Transportation in the United States?
Percentage of Population Employed in Transportation in the United States is 3.8%.