Cities with the Highest Percentage of Population Employed in Transportation in Connecticut
RELATED REPORTS & OPTIONS
Transportation
Connecticut
Compare Cities
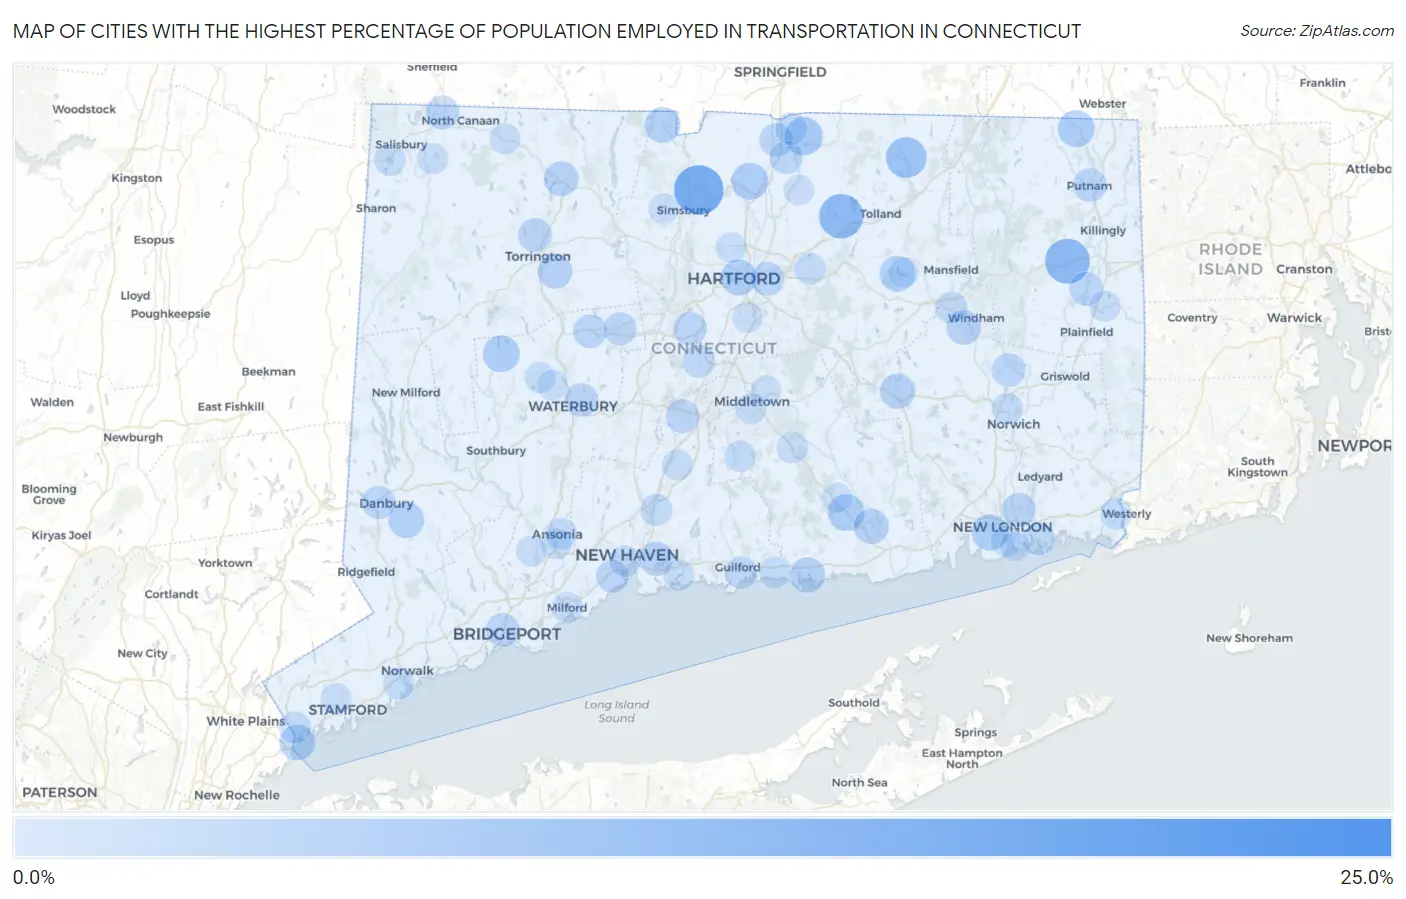
Map of Cities with the Highest Percentage of Population Employed in Transportation in Connecticut
0.0%
25.0%
Cities with the Highest Percentage of Population Employed in Transportation in Connecticut
| City | % Employed | vs State | vs National | |
| 1. | Bogus Hill | 24.2% | 3.1%(+21.1)#1 | 3.8%(+20.4)#519 |
| 2. | Sail Harbor | 18.9% | 3.1%(+15.9)#2 | 3.8%(+15.1)#885 |
| 3. | Tariffville | 16.3% | 3.1%(+13.3)#3 | 3.8%(+12.5)#1,216 |
| 4. | Brooklyn | 12.7% | 3.1%(+9.63)#4 | 3.8%(+8.89)#1,988 |
| 5. | Rockville | 12.4% | 3.1%(+9.33)#5 | 3.8%(+8.58)#2,088 |
| 6. | Lakeside Woods | 11.7% | 3.1%(+8.65)#6 | 3.8%(+7.90)#2,345 |
| 7. | Stafford Springs | 9.7% | 3.1%(+6.59)#7 | 3.8%(+5.85)#3,337 |
| 8. | Inglenook | 8.3% | 3.1%(+5.26)#8 | 3.8%(+4.52)#4,410 |
| 9. | Hazardville | 7.8% | 3.1%(+4.69)#9 | 3.8%(+3.94)#5,005 |
| 10. | Windsor Locks | 7.0% | 3.1%(+3.88)#10 | 3.8%(+3.13)#6,025 |
| 11. | Quinebaug | 6.9% | 3.1%(+3.84)#11 | 3.8%(+3.09)#6,102 |
| 12. | Trumbull Center | 6.9% | 3.1%(+3.82)#12 | 3.8%(+3.07)#6,141 |
| 13. | Bethlehem Village | 6.8% | 3.1%(+3.77)#13 | 3.8%(+3.02)#6,207 |
| 14. | Deep River Center | 6.7% | 3.1%(+3.67)#14 | 3.8%(+2.92)#6,367 |
| 15. | Waterford | 6.6% | 3.1%(+3.56)#15 | 3.8%(+2.81)#6,537 |
| 16. | Lake Bungee | 6.3% | 3.1%(+3.27)#16 | 3.8%(+2.52)#7,002 |
| 17. | Hartford | 6.2% | 3.1%(+3.15)#17 | 3.8%(+2.40)#7,222 |
| 18. | Bethel | 6.2% | 3.1%(+3.14)#18 | 3.8%(+2.39)#7,236 |
| 19. | Coventry Lake | 6.2% | 3.1%(+3.13)#19 | 3.8%(+2.38)#7,257 |
| 20. | Stratford Downtown | 6.2% | 3.1%(+3.09)#20 | 3.8%(+2.34)#7,334 |
| 21. | Oronoque | 6.1% | 3.1%(+3.00)#21 | 3.8%(+2.25)#7,500 |
| 22. | Byram | 6.0% | 3.1%(+2.98)#22 | 3.8%(+2.23)#7,553 |
| 23. | North Granby | 6.0% | 3.1%(+2.97)#23 | 3.8%(+2.22)#7,573 |
| 24. | Colchester | 5.7% | 3.1%(+2.64)#24 | 3.8%(+1.89)#8,235 |
| 25. | Essex Village | 5.7% | 3.1%(+2.62)#25 | 3.8%(+1.87)#8,272 |
| 26. | Clinton | 5.7% | 3.1%(+2.59)#26 | 3.8%(+1.84)#8,372 |
| 27. | West Cornwall | 5.6% | 3.1%(+2.49)#27 | 3.8%(+1.74)#8,629 |
| 28. | Bantam Borough | 5.5% | 3.1%(+2.42)#28 | 3.8%(+1.67)#8,754 |
| 29. | Winsted | 5.3% | 3.1%(+2.22)#29 | 3.8%(+1.47)#9,224 |
| 30. | Northwest Harwinton | 5.3% | 3.1%(+2.21)#30 | 3.8%(+1.46)#9,232 |
| 31. | South Windham | 5.1% | 3.1%(+2.03)#31 | 3.8%(+1.28)#9,692 |
| 32. | East Haven | 4.9% | 3.1%(+1.88)#32 | 3.8%(+1.13)#10,082 |
| 33. | Conning Towers Nautilus Park | 4.8% | 3.1%(+1.72)#33 | 3.8%(+0.973)#10,496 |
| 34. | Taylor Corners | 4.7% | 3.1%(+1.67)#34 | 3.8%(+0.924)#10,640 |
| 35. | Knollcrest | 4.7% | 3.1%(+1.67)#35 | 3.8%(+0.920)#10,657 |
| 36. | Torrington | 4.7% | 3.1%(+1.64)#36 | 3.8%(+0.891)#10,730 |
| 37. | Terryville | 4.7% | 3.1%(+1.62)#37 | 3.8%(+0.871)#10,780 |
| 38. | East Hartford | 4.7% | 3.1%(+1.60)#38 | 3.8%(+0.855)#10,834 |
| 39. | Canaan | 4.7% | 3.1%(+1.58)#39 | 3.8%(+0.834)#10,882 |
| 40. | Thompsonville | 4.6% | 3.1%(+1.55)#40 | 3.8%(+0.797)#10,996 |
| 41. | Wauregan | 4.6% | 3.1%(+1.54)#41 | 3.8%(+0.794)#11,002 |
| 42. | Baltic | 4.6% | 3.1%(+1.54)#42 | 3.8%(+0.788)#11,022 |
| 43. | Meriden | 4.6% | 3.1%(+1.50)#43 | 3.8%(+0.757)#11,126 |
| 44. | Waterbury | 4.6% | 3.1%(+1.50)#44 | 3.8%(+0.749)#11,144 |
| 45. | New Britain | 4.5% | 3.1%(+1.47)#45 | 3.8%(+0.719)#11,240 |
| 46. | Bridgeport | 4.5% | 3.1%(+1.43)#46 | 3.8%(+0.686)#11,325 |
| 47. | Putnam | 4.4% | 3.1%(+1.36)#47 | 3.8%(+0.612)#11,588 |
| 48. | Danbury | 4.4% | 3.1%(+1.34)#48 | 3.8%(+0.591)#11,657 |
| 49. | Bridgewater | 4.2% | 3.1%(+1.10)#49 | 3.8%(+0.350)#12,455 |
| 50. | Bristol | 4.1% | 3.1%(+1.03)#50 | 3.8%(+0.282)#12,670 |
| 51. | Southwood Acres | 4.1% | 3.1%(+0.992)#51 | 3.8%(+0.243)#12,815 |
| 52. | West Haven | 4.0% | 3.1%(+0.928)#52 | 3.8%(+0.180)#13,005 |
| 53. | Kensington | 3.9% | 3.1%(+0.875)#53 | 3.8%(+0.127)#13,180 |
| 54. | Poquonock Bridge | 3.9% | 3.1%(+0.873)#54 | 3.8%(+0.125)#13,187 |
| 55. | Naugatuck Borough | 3.7% | 3.1%(+0.596)#55 | 3.8%(-0.152)#14,167 |
| 56. | Guilford Center | 3.6% | 3.1%(+0.574)#56 | 3.8%(-0.174)#14,234 |
| 57. | Bigelow Corners | 3.6% | 3.1%(+0.491)#57 | 3.8%(-0.257)#14,528 |
| 58. | Ridgebury | 3.5% | 3.1%(+0.440)#58 | 3.8%(-0.308)#14,706 |
| 59. | Pemberwick | 3.5% | 3.1%(+0.426)#59 | 3.8%(-0.322)#14,760 |
| 60. | North Haven | 3.4% | 3.1%(+0.365)#60 | 3.8%(-0.383)#14,986 |
| 61. | Sherwood Manor | 3.4% | 3.1%(+0.346)#61 | 3.8%(-0.403)#15,063 |
| 62. | Pawcatuck | 3.4% | 3.1%(+0.299)#62 | 3.8%(-0.449)#15,251 |
| 63. | Stepney | 3.3% | 3.1%(+0.268)#63 | 3.8%(-0.480)#15,351 |
| 64. | Willimantic | 3.3% | 3.1%(+0.185)#64 | 3.8%(-0.563)#15,658 |
| 65. | Lakeville | 3.2% | 3.1%(+0.119)#65 | 3.8%(-0.630)#15,890 |
| 66. | Staples | 3.2% | 3.1%(+0.105)#66 | 3.8%(-0.643)#15,946 |
| 67. | Manchester | 3.2% | 3.1%(+0.102)#67 | 3.8%(-0.646)#15,950 |
| 68. | Ansonia | 3.1% | 3.1%(+0.013)#68 | 3.8%(-0.735)#16,257 |
| 69. | Madison Center | 3.0% | 3.1%(-0.020)#69 | 3.8%(-0.768)#16,375 |
| 70. | Durham | 3.0% | 3.1%(-0.035)#70 | 3.8%(-0.784)#16,426 |
| 71. | Ball Pond | 3.0% | 3.1%(-0.041)#71 | 3.8%(-0.789)#16,465 |
| 72. | New Haven | 3.0% | 3.1%(-0.080)#72 | 3.8%(-0.829)#16,600 |
| 73. | Norwich | 2.9% | 3.1%(-0.132)#73 | 3.8%(-0.881)#16,814 |
| 74. | Norwalk | 2.9% | 3.1%(-0.137)#74 | 3.8%(-0.886)#16,829 |
| 75. | New London | 2.8% | 3.1%(-0.222)#75 | 3.8%(-0.970)#17,142 |
| 76. | Higganum | 2.8% | 3.1%(-0.279)#76 | 3.8%(-1.03)#17,355 |
| 77. | Falls Village | 2.7% | 3.1%(-0.329)#77 | 3.8%(-1.08)#17,548 |
| 78. | Wallingford Center | 2.7% | 3.1%(-0.346)#78 | 3.8%(-1.09)#17,607 |
| 79. | Watertown | 2.7% | 3.1%(-0.346)#79 | 3.8%(-1.09)#17,609 |
| 80. | Moosup | 2.7% | 3.1%(-0.376)#80 | 3.8%(-1.12)#17,723 |
| 81. | Milford City Balance | 2.7% | 3.1%(-0.408)#81 | 3.8%(-1.16)#17,841 |
| 82. | Derby | 2.7% | 3.1%(-0.414)#82 | 3.8%(-1.16)#17,859 |
| 83. | Middletown | 2.6% | 3.1%(-0.423)#83 | 3.8%(-1.17)#17,890 |
| 84. | Stamford | 2.6% | 3.1%(-0.449)#84 | 3.8%(-1.20)#17,992 |
| 85. | Norfolk | 2.6% | 3.1%(-0.505)#85 | 3.8%(-1.25)#18,215 |
| 86. | Branford Center | 2.5% | 3.1%(-0.540)#86 | 3.8%(-1.29)#18,343 |
| 87. | Oakville | 2.5% | 3.1%(-0.613)#87 | 3.8%(-1.36)#18,577 |
| 88. | Blue Hills | 2.4% | 3.1%(-0.622)#88 | 3.8%(-1.37)#18,609 |
| 89. | Wethersfield | 2.4% | 3.1%(-0.686)#89 | 3.8%(-1.43)#18,847 |
| 90. | Groton Long Point Borough | 2.3% | 3.1%(-0.725)#90 | 3.8%(-1.47)#19,003 |
| 91. | West Simsbury | 2.3% | 3.1%(-0.778)#91 | 3.8%(-1.53)#19,167 |
| 92. | Broad Brook | 2.3% | 3.1%(-0.817)#92 | 3.8%(-1.56)#19,333 |
| 93. | Shelton | 2.2% | 3.1%(-0.831)#93 | 3.8%(-1.58)#19,387 |
| 94. | Stonington Borough | 2.1% | 3.1%(-0.921)#94 | 3.8%(-1.67)#19,750 |
| 95. | Jewett City Borough | 2.1% | 3.1%(-0.966)#95 | 3.8%(-1.71)#19,896 |
| 96. | South Coventry | 2.1% | 3.1%(-0.971)#96 | 3.8%(-1.72)#19,908 |
| 97. | Saugatuck | 2.1% | 3.1%(-0.981)#97 | 3.8%(-1.73)#19,942 |
| 98. | Chester Center | 2.0% | 3.1%(-1.08)#98 | 3.8%(-1.83)#20,282 |
| 99. | Portland | 2.0% | 3.1%(-1.09)#99 | 3.8%(-1.83)#20,291 |
| 100. | Groton | 1.9% | 3.1%(-1.13)#100 | 3.8%(-1.87)#20,413 |
Common Questions
What are the Top 10 Cities with the Highest Percentage of Population Employed in Transportation in Connecticut?
Top 10 Cities with the Highest Percentage of Population Employed in Transportation in Connecticut are:
#1
16.3%
#2
12.7%
#3
12.4%
#4
9.7%
#5
7.8%
#6
7.0%
#7
6.9%
#8
6.8%
#9
6.7%
#10
6.6%
What city has the Highest Percentage of Population Employed in Transportation in Connecticut?
Tariffville has the Highest Percentage of Population Employed in Transportation in Connecticut with 16.3%.
What is the Percentage of Population Employed in Transportation in the State of Connecticut?
Percentage of Population Employed in Transportation in Connecticut is 3.1%.
What is the Percentage of Population Employed in Transportation in the United States?
Percentage of Population Employed in Transportation in the United States is 3.8%.