Cities with the Highest Percentage of Population Employed in Transportation in Indiana
RELATED REPORTS & OPTIONS
Transportation
Indiana
Compare Cities
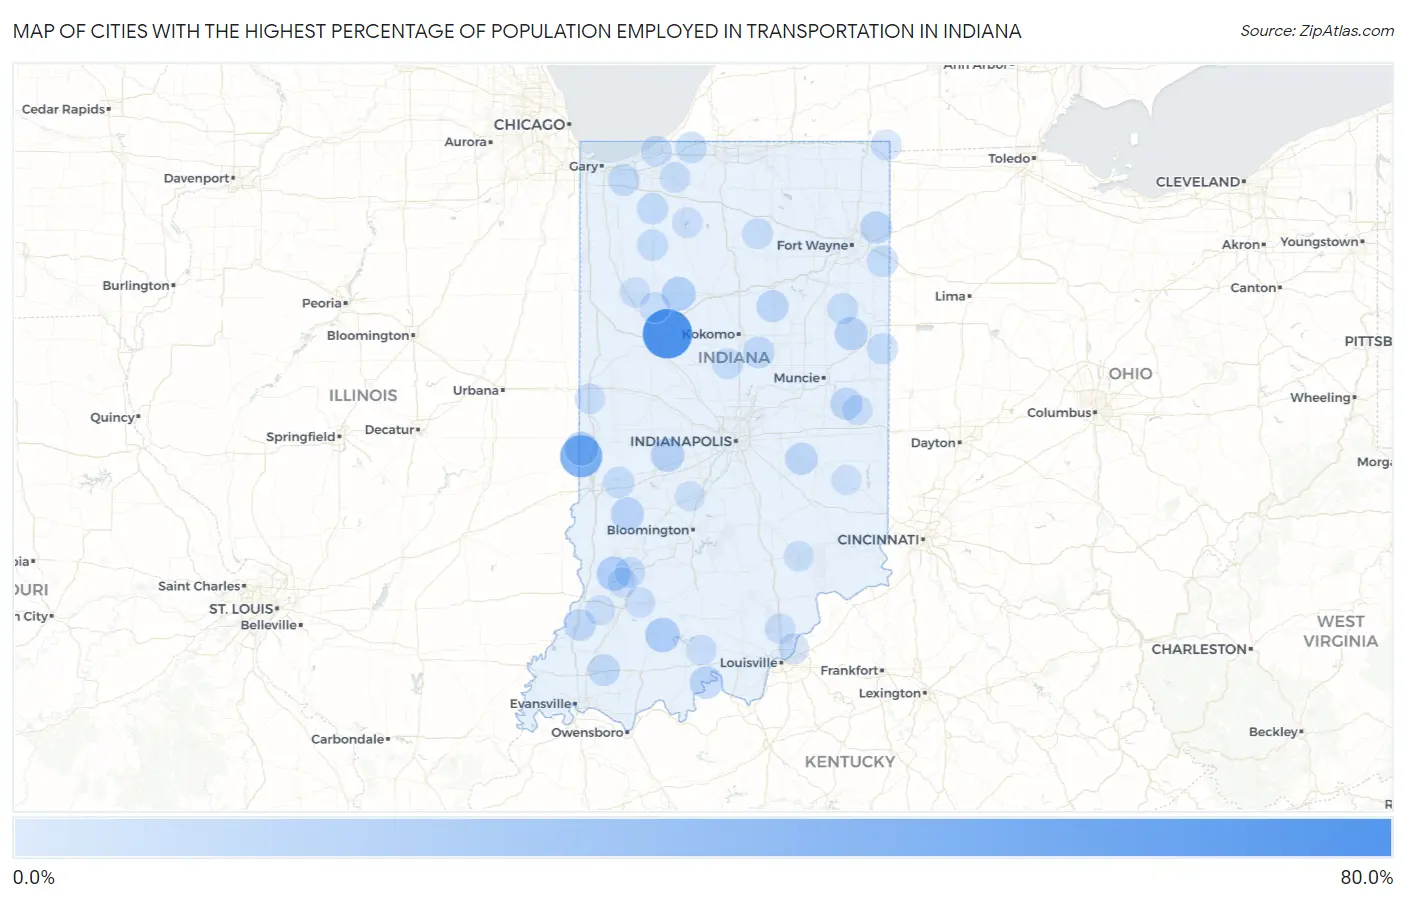
Map of Cities with the Highest Percentage of Population Employed in Transportation in Indiana
0.0%
80.0%
Cities with the Highest Percentage of Population Employed in Transportation in Indiana
| City | % Employed | vs State | vs National | |
| 1. | Buck Creek | 61.4% | 4.0%(+57.4)#1 | 3.8%(+57.6)#51 |
| 2. | Webster | 55.8% | 4.0%(+51.8)#2 | 3.8%(+52.0)#62 |
| 3. | Paris Crossing | 53.3% | 4.0%(+49.4)#3 | 3.8%(+49.5)#80 |
| 4. | Shipshewana Lake | 50.6% | 4.0%(+46.6)#4 | 3.8%(+46.8)#91 |
| 5. | Goldsmith | 48.8% | 4.0%(+44.8)#5 | 3.8%(+45.0)#107 |
| 6. | Blanford | 41.4% | 4.0%(+37.5)#6 | 3.8%(+37.6)#158 |
| 7. | Hortonville | 37.6% | 4.0%(+33.6)#7 | 3.8%(+33.8)#197 |
| 8. | Judson | 37.5% | 4.0%(+33.5)#8 | 3.8%(+33.7)#201 |
| 9. | Letts | 34.3% | 4.0%(+30.3)#9 | 3.8%(+30.5)#254 |
| 10. | Folsomville | 34.0% | 4.0%(+30.1)#10 | 3.8%(+30.2)#260 |
| 11. | Depauw | 33.3% | 4.0%(+29.4)#11 | 3.8%(+29.5)#272 |
| 12. | Oswego | 32.8% | 4.0%(+28.9)#12 | 3.8%(+29.0)#291 |
| 13. | Judyville | 29.0% | 4.0%(+25.1)#13 | 3.8%(+25.2)#359 |
| 14. | Malden | 29.0% | 4.0%(+25.0)#14 | 3.8%(+25.2)#363 |
| 15. | Sumava Resorts | 28.6% | 4.0%(+24.6)#15 | 3.8%(+24.8)#370 |
| 16. | St. Omer | 25.0% | 4.0%(+21.0)#16 | 3.8%(+21.2)#494 |
| 17. | Blairsville | 22.9% | 4.0%(+18.9)#17 | 3.8%(+19.0)#595 |
| 18. | Wellsboro | 22.6% | 4.0%(+18.7)#18 | 3.8%(+18.8)#611 |
| 19. | Delaware | 20.9% | 4.0%(+16.9)#19 | 3.8%(+17.1)#720 |
| 20. | Dubois | 20.7% | 4.0%(+16.7)#20 | 3.8%(+16.9)#738 |
| 21. | Westphalia | 20.4% | 4.0%(+16.4)#21 | 3.8%(+16.6)#759 |
| 22. | St Bernice | 20.3% | 4.0%(+16.4)#22 | 3.8%(+16.5)#764 |
| 23. | Talma | 20.0% | 4.0%(+16.0)#23 | 3.8%(+16.2)#792 |
| 24. | Mace | 20.0% | 4.0%(+16.0)#24 | 3.8%(+16.2)#796 |
| 25. | Bridgeton | 20.0% | 4.0%(+16.0)#25 | 3.8%(+16.2)#803 |
| 26. | Idaville | 19.4% | 4.0%(+15.4)#26 | 3.8%(+15.6)#849 |
| 27. | Andersonville | 19.0% | 4.0%(+15.0)#27 | 3.8%(+15.2)#881 |
| 28. | Fillmore | 18.6% | 4.0%(+14.7)#28 | 3.8%(+14.8)#912 |
| 29. | Bringhurst | 18.4% | 4.0%(+14.5)#29 | 3.8%(+14.6)#946 |
| 30. | Eminence | 18.4% | 4.0%(+14.4)#30 | 3.8%(+14.6)#953 |
| 31. | Adams | 18.2% | 4.0%(+14.2)#31 | 3.8%(+14.4)#973 |
| 32. | Gwynneville | 18.1% | 4.0%(+14.1)#32 | 3.8%(+14.3)#994 |
| 33. | Cree Lake | 17.9% | 4.0%(+14.0)#33 | 3.8%(+14.1)#1,008 |
| 34. | Commiskey | 17.9% | 4.0%(+13.9)#34 | 3.8%(+14.0)#1,023 |
| 35. | Pennville | 17.5% | 4.0%(+13.6)#35 | 3.8%(+13.7)#1,058 |
| 36. | Philadelphia | 17.4% | 4.0%(+13.5)#36 | 3.8%(+13.6)#1,070 |
| 37. | Lyford | 17.3% | 4.0%(+13.3)#37 | 3.8%(+13.4)#1,087 |
| 38. | Clay City | 17.0% | 4.0%(+13.0)#38 | 3.8%(+13.2)#1,121 |
| 39. | Alton | 16.7% | 4.0%(+12.7)#39 | 3.8%(+12.8)#1,184 |
| 40. | Liberty Mills | 16.1% | 4.0%(+12.1)#40 | 3.8%(+12.2)#1,253 |
| 41. | Glezen | 15.9% | 4.0%(+11.9)#41 | 3.8%(+12.1)#1,273 |
| 42. | Lakewood | 15.7% | 4.0%(+11.7)#42 | 3.8%(+11.8)#1,305 |
| 43. | Raub | 15.5% | 4.0%(+11.5)#43 | 3.8%(+11.7)#1,338 |
| 44. | Arlington | 15.4% | 4.0%(+11.4)#44 | 3.8%(+11.6)#1,348 |
| 45. | Bowling Green | 15.2% | 4.0%(+11.2)#45 | 3.8%(+11.4)#1,394 |
| 46. | Hoffman Lake | 15.2% | 4.0%(+11.2)#46 | 3.8%(+11.3)#1,400 |
| 47. | Lake Everett | 15.2% | 4.0%(+11.2)#47 | 3.8%(+11.3)#1,402 |
| 48. | Harlan | 15.0% | 4.0%(+11.1)#48 | 3.8%(+11.2)#1,422 |
| 49. | Somerset | 15.0% | 4.0%(+11.0)#49 | 3.8%(+11.1)#1,440 |
| 50. | Losantville | 14.8% | 4.0%(+10.9)#50 | 3.8%(+11.0)#1,471 |
| 51. | Grammer | 14.8% | 4.0%(+10.8)#51 | 3.8%(+11.0)#1,484 |
| 52. | Lynnville | 14.2% | 4.0%(+10.3)#52 | 3.8%(+10.4)#1,591 |
| 53. | Windfall City | 14.2% | 4.0%(+10.2)#53 | 3.8%(+10.4)#1,593 |
| 54. | Decker | 14.1% | 4.0%(+10.2)#54 | 3.8%(+10.3)#1,611 |
| 55. | South Center | 14.1% | 4.0%(+10.1)#55 | 3.8%(+10.3)#1,619 |
| 56. | Tippecanoe | 13.7% | 4.0%(+9.73)#56 | 3.8%(+9.87)#1,711 |
| 57. | Tyner | 13.6% | 4.0%(+9.60)#57 | 3.8%(+9.74)#1,738 |
| 58. | Salt Creek Commons | 13.5% | 4.0%(+9.53)#58 | 3.8%(+9.67)#1,752 |
| 59. | La Crosse | 13.5% | 4.0%(+9.51)#59 | 3.8%(+9.65)#1,758 |
| 60. | Monroeville | 13.4% | 4.0%(+9.44)#60 | 3.8%(+9.58)#1,785 |
| 61. | Hudson Lake | 13.2% | 4.0%(+9.19)#61 | 3.8%(+9.34)#1,853 |
| 62. | Anoka | 13.1% | 4.0%(+9.17)#62 | 3.8%(+9.31)#1,858 |
| 63. | Blue Ridge | 13.1% | 4.0%(+9.15)#63 | 3.8%(+9.30)#1,864 |
| 64. | Chain-O-Lakes | 13.0% | 4.0%(+9.03)#64 | 3.8%(+9.17)#1,895 |
| 65. | Brownsville | 13.0% | 4.0%(+9.00)#65 | 3.8%(+9.15)#1,903 |
| 66. | Poneto | 12.8% | 4.0%(+8.83)#66 | 3.8%(+8.97)#1,960 |
| 67. | Salamonia | 12.8% | 4.0%(+8.81)#67 | 3.8%(+8.95)#1,968 |
| 68. | Staunton | 12.7% | 4.0%(+8.78)#68 | 3.8%(+8.93)#1,974 |
| 69. | Medaryville | 12.6% | 4.0%(+8.59)#69 | 3.8%(+8.73)#2,029 |
| 70. | Kempton | 12.4% | 4.0%(+8.42)#70 | 3.8%(+8.56)#2,093 |
| 71. | Chalmers | 11.9% | 4.0%(+7.92)#71 | 3.8%(+8.07)#2,277 |
| 72. | Trail Creek | 11.8% | 4.0%(+7.87)#72 | 3.8%(+8.01)#2,298 |
| 73. | Burket | 11.8% | 4.0%(+7.80)#73 | 3.8%(+7.95)#2,324 |
| 74. | Laud | 11.8% | 4.0%(+7.80)#74 | 3.8%(+7.95)#2,330 |
| 75. | Poland | 11.7% | 4.0%(+7.73)#75 | 3.8%(+7.87)#2,351 |
| 76. | Clear Lake | 11.6% | 4.0%(+7.62)#76 | 3.8%(+7.77)#2,391 |
| 77. | Kingsbury | 11.4% | 4.0%(+7.47)#77 | 3.8%(+7.61)#2,458 |
| 78. | Servia | 11.4% | 4.0%(+7.44)#78 | 3.8%(+7.58)#2,475 |
| 79. | Utica | 11.4% | 4.0%(+7.42)#79 | 3.8%(+7.57)#2,482 |
| 80. | Grandview Lake | 11.4% | 4.0%(+7.39)#80 | 3.8%(+7.54)#2,494 |
| 81. | Elnora | 11.3% | 4.0%(+7.38)#81 | 3.8%(+7.52)#2,499 |
| 82. | Pittsburg | 11.3% | 4.0%(+7.31)#82 | 3.8%(+7.45)#2,526 |
| 83. | Bass Lake | 11.2% | 4.0%(+7.25)#83 | 3.8%(+7.39)#2,551 |
| 84. | Wolcott | 11.1% | 4.0%(+7.17)#84 | 3.8%(+7.32)#2,571 |
| 85. | Beaver Dam | 11.1% | 4.0%(+7.15)#85 | 3.8%(+7.29)#2,593 |
| 86. | English | 11.0% | 4.0%(+7.07)#86 | 3.8%(+7.22)#2,622 |
| 87. | Perrysville | 11.0% | 4.0%(+7.06)#87 | 3.8%(+7.21)#2,631 |
| 88. | Cannelburg | 10.9% | 4.0%(+6.95)#88 | 3.8%(+7.09)#2,678 |
| 89. | Jefferson | 10.9% | 4.0%(+6.95)#89 | 3.8%(+7.09)#2,679 |
| 90. | Economy | 10.6% | 4.0%(+6.65)#90 | 3.8%(+6.79)#2,797 |
| 91. | Vernon | 10.5% | 4.0%(+6.57)#91 | 3.8%(+6.71)#2,831 |
| 92. | Putnamville | 10.5% | 4.0%(+6.51)#92 | 3.8%(+6.65)#2,858 |
| 93. | Memphis | 10.4% | 4.0%(+6.47)#93 | 3.8%(+6.62)#2,875 |
| 94. | Paragon | 10.3% | 4.0%(+6.37)#94 | 3.8%(+6.51)#2,949 |
| 95. | Plainville | 10.3% | 4.0%(+6.35)#95 | 3.8%(+6.49)#2,958 |
| 96. | Enchanted Hills | 10.3% | 4.0%(+6.33)#96 | 3.8%(+6.47)#2,968 |
| 97. | Laurel | 10.1% | 4.0%(+6.14)#97 | 3.8%(+6.28)#3,066 |
| 98. | Eden | 10.0% | 4.0%(+6.04)#98 | 3.8%(+6.18)#3,120 |
| 99. | Maples | 10.0% | 4.0%(+6.04)#99 | 3.8%(+6.18)#3,131 |
| 100. | Monroe City | 10.0% | 4.0%(+6.01)#100 | 3.8%(+6.16)#3,148 |
Common Questions
What are the Top 10 Cities with the Highest Percentage of Population Employed in Transportation in Indiana?
Top 10 Cities with the Highest Percentage of Population Employed in Transportation in Indiana are:
#1
61.4%
#2
41.4%
#3
20.7%
#4
20.4%
#5
20.3%
#6
19.4%
#7
18.6%
#8
17.5%
#9
17.0%
#10
16.7%
What city has the Highest Percentage of Population Employed in Transportation in Indiana?
Buck Creek has the Highest Percentage of Population Employed in Transportation in Indiana with 61.4%.
What is the Percentage of Population Employed in Transportation in the State of Indiana?
Percentage of Population Employed in Transportation in Indiana is 4.0%.
What is the Percentage of Population Employed in Transportation in the United States?
Percentage of Population Employed in Transportation in the United States is 3.8%.