Cities with the Highest Percentage of Population Employed in Transportation in Ohio
RELATED REPORTS & OPTIONS
Transportation
Ohio
Compare Cities
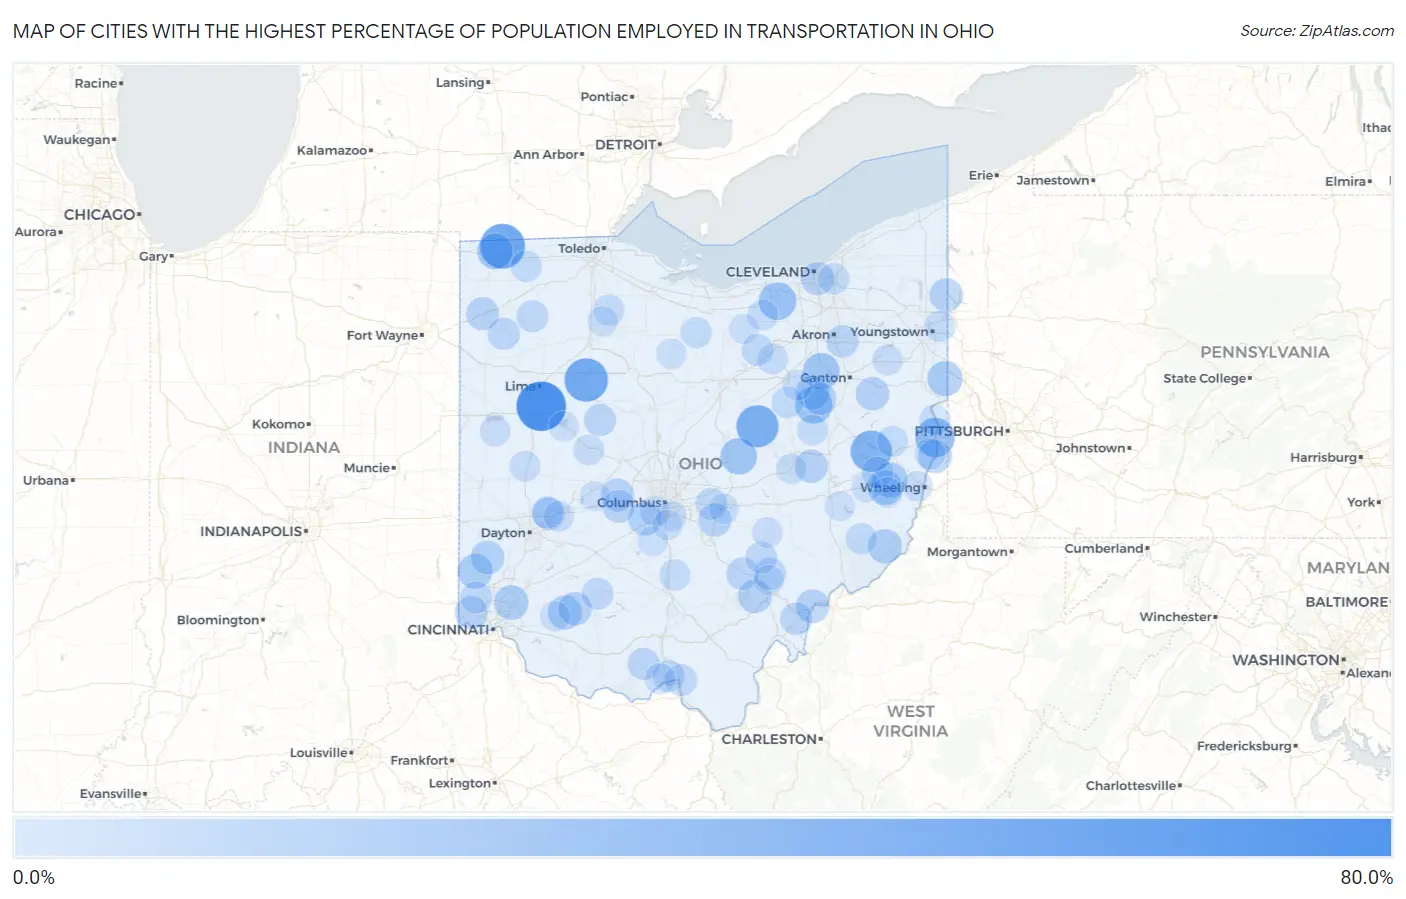
Map of Cities with the Highest Percentage of Population Employed in Transportation in Ohio
0.0%
80.0%
Cities with the Highest Percentage of Population Employed in Transportation in Ohio
| City | % Employed | vs State | vs National | |
| 1. | Uniopolis | 63.0% | 3.8%(+59.2)#1 | 3.8%(+59.1)#49 |
| 2. | Alvordton | 50.0% | 3.8%(+46.2)#2 | 3.8%(+46.2)#93 |
| 3. | Dola | 46.4% | 3.8%(+42.6)#3 | 3.8%(+42.6)#127 |
| 4. | Gann Brinkhaven | 42.7% | 3.8%(+38.9)#4 | 3.8%(+38.8)#152 |
| 5. | Deersville | 40.7% | 3.8%(+36.9)#5 | 3.8%(+36.9)#165 |
| 6. | Pottery Addition | 35.1% | 3.8%(+31.3)#6 | 3.8%(+31.2)#240 |
| 7. | Eaton Estates | 30.4% | 3.8%(+26.6)#7 | 3.8%(+26.6)#329 |
| 8. | Winesburg | 29.9% | 3.8%(+26.1)#8 | 3.8%(+26.1)#340 |
| 9. | Woodsdale | 29.7% | 3.8%(+25.9)#9 | 3.8%(+25.9)#343 |
| 10. | North Lawrence | 27.8% | 3.8%(+24.0)#10 | 3.8%(+24.0)#396 |
| 11. | Martinsburg | 27.6% | 3.8%(+23.8)#11 | 3.8%(+23.8)#402 |
| 12. | Kunkle | 25.8% | 3.8%(+22.0)#12 | 3.8%(+22.0)#462 |
| 13. | Lafferty | 24.4% | 3.8%(+20.6)#13 | 3.8%(+20.5)#511 |
| 14. | Negley | 24.1% | 3.8%(+20.3)#14 | 3.8%(+20.3)#524 |
| 15. | Morristown | 23.4% | 3.8%(+19.6)#15 | 3.8%(+19.5)#559 |
| 16. | Darrtown | 23.1% | 3.8%(+19.3)#16 | 3.8%(+19.3)#575 |
| 17. | Brecon | 22.5% | 3.8%(+18.7)#17 | 3.8%(+18.6)#619 |
| 18. | Antioch | 21.4% | 3.8%(+17.6)#18 | 3.8%(+17.6)#683 |
| 19. | St Martin | 21.2% | 3.8%(+17.5)#19 | 3.8%(+17.4)#697 |
| 20. | Mount Eaton | 20.9% | 3.8%(+17.1)#20 | 3.8%(+17.1)#718 |
| 21. | West Elkton | 20.3% | 3.8%(+16.5)#21 | 3.8%(+16.5)#763 |
| 22. | Brilliant | 20.2% | 3.8%(+16.4)#22 | 3.8%(+16.4)#776 |
| 23. | Darbydale | 20.2% | 3.8%(+16.4)#23 | 3.8%(+16.4)#778 |
| 24. | New Haven Cdp Huron County | 20.1% | 3.8%(+16.3)#24 | 3.8%(+16.3)#782 |
| 25. | New Marshfield | 20.0% | 3.8%(+16.2)#25 | 3.8%(+16.2)#789 |
| 26. | Orangeville | 20.0% | 3.8%(+16.2)#26 | 3.8%(+16.2)#791 |
| 27. | Little Hocking | 19.9% | 3.8%(+16.1)#27 | 3.8%(+16.1)#817 |
| 28. | Malvern | 19.7% | 3.8%(+15.9)#28 | 3.8%(+15.9)#829 |
| 29. | Lynchburg | 19.6% | 3.8%(+15.8)#29 | 3.8%(+15.7)#835 |
| 30. | Plainfield | 19.4% | 3.8%(+15.6)#30 | 3.8%(+15.5)#852 |
| 31. | Cecil | 18.8% | 3.8%(+15.0)#31 | 3.8%(+14.9)#899 |
| 32. | Plumwood | 18.7% | 3.8%(+14.9)#32 | 3.8%(+14.9)#905 |
| 33. | Newburgh Heights | 18.7% | 3.8%(+14.9)#33 | 3.8%(+14.9)#908 |
| 34. | Thurston | 18.6% | 3.8%(+14.8)#34 | 3.8%(+14.8)#914 |
| 35. | Wilmot | 18.4% | 3.8%(+14.6)#35 | 3.8%(+14.6)#952 |
| 36. | Miamitown | 18.3% | 3.8%(+14.5)#36 | 3.8%(+14.5)#957 |
| 37. | New Haven Cdp Hamilton County | 18.1% | 3.8%(+14.3)#37 | 3.8%(+14.3)#992 |
| 38. | Lafayette | 17.8% | 3.8%(+14.0)#38 | 3.8%(+14.0)#1,026 |
| 39. | Newport Cdp Washington County | 17.5% | 3.8%(+13.7)#39 | 3.8%(+13.6)#1,066 |
| 40. | Crystal Lakes | 17.3% | 3.8%(+13.5)#40 | 3.8%(+13.4)#1,089 |
| 41. | Tuppers Plains | 17.2% | 3.8%(+13.4)#41 | 3.8%(+13.4)#1,090 |
| 42. | Sawyerwood | 17.1% | 3.8%(+13.3)#42 | 3.8%(+13.3)#1,107 |
| 43. | Haydenville | 16.8% | 3.8%(+13.0)#43 | 3.8%(+13.0)#1,143 |
| 44. | Melrose | 16.7% | 3.8%(+12.9)#44 | 3.8%(+12.8)#1,160 |
| 45. | Ridgeway | 16.6% | 3.8%(+12.8)#45 | 3.8%(+12.7)#1,190 |
| 46. | New Springfield | 16.5% | 3.8%(+12.8)#46 | 3.8%(+12.7)#1,191 |
| 47. | Jacksonville | 16.4% | 3.8%(+12.7)#47 | 3.8%(+12.6)#1,203 |
| 48. | Blaine | 16.3% | 3.8%(+12.5)#48 | 3.8%(+12.5)#1,214 |
| 49. | Otway | 16.0% | 3.8%(+12.2)#49 | 3.8%(+12.2)#1,261 |
| 50. | New Bavaria | 15.6% | 3.8%(+11.8)#50 | 3.8%(+11.8)#1,316 |
| 51. | Cinnamon Lake | 15.6% | 3.8%(+11.8)#51 | 3.8%(+11.7)#1,325 |
| 52. | Sciotodale | 15.4% | 3.8%(+11.6)#52 | 3.8%(+11.6)#1,345 |
| 53. | Park Layne | 15.3% | 3.8%(+11.5)#53 | 3.8%(+11.5)#1,368 |
| 54. | Kirkersville | 15.3% | 3.8%(+11.5)#54 | 3.8%(+11.5)#1,370 |
| 55. | Ross | 15.3% | 3.8%(+11.5)#55 | 3.8%(+11.4)#1,381 |
| 56. | Hemlock | 15.2% | 3.8%(+11.4)#56 | 3.8%(+11.4)#1,384 |
| 57. | Rosemount | 15.1% | 3.8%(+11.3)#57 | 3.8%(+11.3)#1,404 |
| 58. | Highland | 15.1% | 3.8%(+11.3)#58 | 3.8%(+11.3)#1,416 |
| 59. | Holmesville | 14.8% | 3.8%(+11.0)#59 | 3.8%(+11.0)#1,470 |
| 60. | Holloway | 14.6% | 3.8%(+10.8)#60 | 3.8%(+10.8)#1,524 |
| 61. | Stafford | 14.3% | 3.8%(+10.5)#61 | 3.8%(+10.5)#1,576 |
| 62. | Pettisville | 14.1% | 3.8%(+10.3)#62 | 3.8%(+10.3)#1,613 |
| 63. | Massieville | 14.1% | 3.8%(+10.3)#63 | 3.8%(+10.3)#1,621 |
| 64. | Maplewood Park | 14.0% | 3.8%(+10.2)#64 | 3.8%(+10.2)#1,638 |
| 65. | Highland Hills | 13.9% | 3.8%(+10.1)#65 | 3.8%(+10.1)#1,656 |
| 66. | West Millgrove | 13.8% | 3.8%(+10.1)#66 | 3.8%(+10.0)#1,674 |
| 67. | Reno Beach | 13.8% | 3.8%(+10.0)#67 | 3.8%(+10.0)#1,677 |
| 68. | Jewett | 13.7% | 3.8%(+9.91)#68 | 3.8%(+9.89)#1,704 |
| 69. | Empire | 13.4% | 3.8%(+9.60)#69 | 3.8%(+9.58)#1,786 |
| 70. | Kingston | 13.3% | 3.8%(+9.49)#70 | 3.8%(+9.47)#1,820 |
| 71. | Holiday Lakes | 13.3% | 3.8%(+9.48)#71 | 3.8%(+9.46)#1,824 |
| 72. | Baltic | 13.2% | 3.8%(+9.41)#72 | 3.8%(+9.39)#1,835 |
| 73. | New Alexandria | 13.2% | 3.8%(+9.36)#73 | 3.8%(+9.34)#1,847 |
| 74. | Urbancrest | 13.0% | 3.8%(+9.25)#74 | 3.8%(+9.23)#1,875 |
| 75. | Congress | 12.9% | 3.8%(+9.11)#75 | 3.8%(+9.09)#1,924 |
| 76. | West Portsmouth | 12.8% | 3.8%(+9.02)#76 | 3.8%(+9.00)#1,951 |
| 77. | Lockington | 12.8% | 3.8%(+9.00)#77 | 3.8%(+8.97)#1,959 |
| 78. | Pheasant Run | 12.7% | 3.8%(+8.95)#78 | 3.8%(+8.92)#1,976 |
| 79. | Maple Ridge | 12.7% | 3.8%(+8.89)#79 | 3.8%(+8.86)#1,996 |
| 80. | Valley Hi | 12.6% | 3.8%(+8.85)#80 | 3.8%(+8.83)#2,005 |
| 81. | Crooksville | 12.2% | 3.8%(+8.39)#81 | 3.8%(+8.37)#2,163 |
| 82. | Apple Creek | 12.2% | 3.8%(+8.37)#82 | 3.8%(+8.35)#2,168 |
| 83. | Wolfhurst | 12.1% | 3.8%(+8.29)#83 | 3.8%(+8.27)#2,195 |
| 84. | Chickasaw | 12.1% | 3.8%(+8.26)#84 | 3.8%(+8.24)#2,210 |
| 85. | Enon | 11.8% | 3.8%(+8.05)#85 | 3.8%(+8.03)#2,291 |
| 86. | Obetz | 11.8% | 3.8%(+8.02)#86 | 3.8%(+8.00)#2,304 |
| 87. | Conesville | 11.7% | 3.8%(+7.91)#87 | 3.8%(+7.89)#2,348 |
| 88. | Belmont | 11.6% | 3.8%(+7.85)#88 | 3.8%(+7.83)#2,366 |
| 89. | Bloomdale | 11.6% | 3.8%(+7.83)#89 | 3.8%(+7.81)#2,371 |
| 90. | Chatfield | 11.5% | 3.8%(+7.68)#90 | 3.8%(+7.66)#2,437 |
| 91. | Millfield | 11.3% | 3.8%(+7.53)#91 | 3.8%(+7.50)#2,503 |
| 92. | Russells Point | 11.3% | 3.8%(+7.51)#92 | 3.8%(+7.48)#2,514 |
| 93. | Rochester | 11.3% | 3.8%(+7.47)#93 | 3.8%(+7.45)#2,527 |
| 94. | Senecaville | 11.2% | 3.8%(+7.37)#94 | 3.8%(+7.35)#2,564 |
| 95. | Lake Lorelei | 11.1% | 3.8%(+7.32)#95 | 3.8%(+7.29)#2,574 |
| 96. | Darbyville | 11.1% | 3.8%(+7.32)#96 | 3.8%(+7.29)#2,581 |
| 97. | Catawba | 11.1% | 3.8%(+7.32)#97 | 3.8%(+7.29)#2,582 |
| 98. | Lockbourne | 11.1% | 3.8%(+7.32)#98 | 3.8%(+7.29)#2,583 |
| 99. | Fairview | 11.1% | 3.8%(+7.32)#99 | 3.8%(+7.29)#2,602 |
| 100. | Fairfield Beach | 11.1% | 3.8%(+7.28)#100 | 3.8%(+7.25)#2,613 |
Common Questions
What are the Top 10 Cities with the Highest Percentage of Population Employed in Transportation in Ohio?
Top 10 Cities with the Highest Percentage of Population Employed in Transportation in Ohio are:
#1
63.0%
#2
50.0%
#3
46.4%
#4
42.7%
#5
40.7%
#6
35.1%
#7
30.4%
#8
29.9%
#9
27.8%
#10
27.6%
What city has the Highest Percentage of Population Employed in Transportation in Ohio?
Uniopolis has the Highest Percentage of Population Employed in Transportation in Ohio with 63.0%.
What is the Percentage of Population Employed in Transportation in the State of Ohio?
Percentage of Population Employed in Transportation in Ohio is 3.8%.
What is the Percentage of Population Employed in Transportation in the United States?
Percentage of Population Employed in Transportation in the United States is 3.8%.