Cities with the Highest Percentage of Population Employed in Transportation in Minnesota
RELATED REPORTS & OPTIONS
Transportation
Minnesota
Compare Cities
Map of Cities with the Highest Percentage of Population Employed in Transportation in Minnesota
0.0%
50.0%
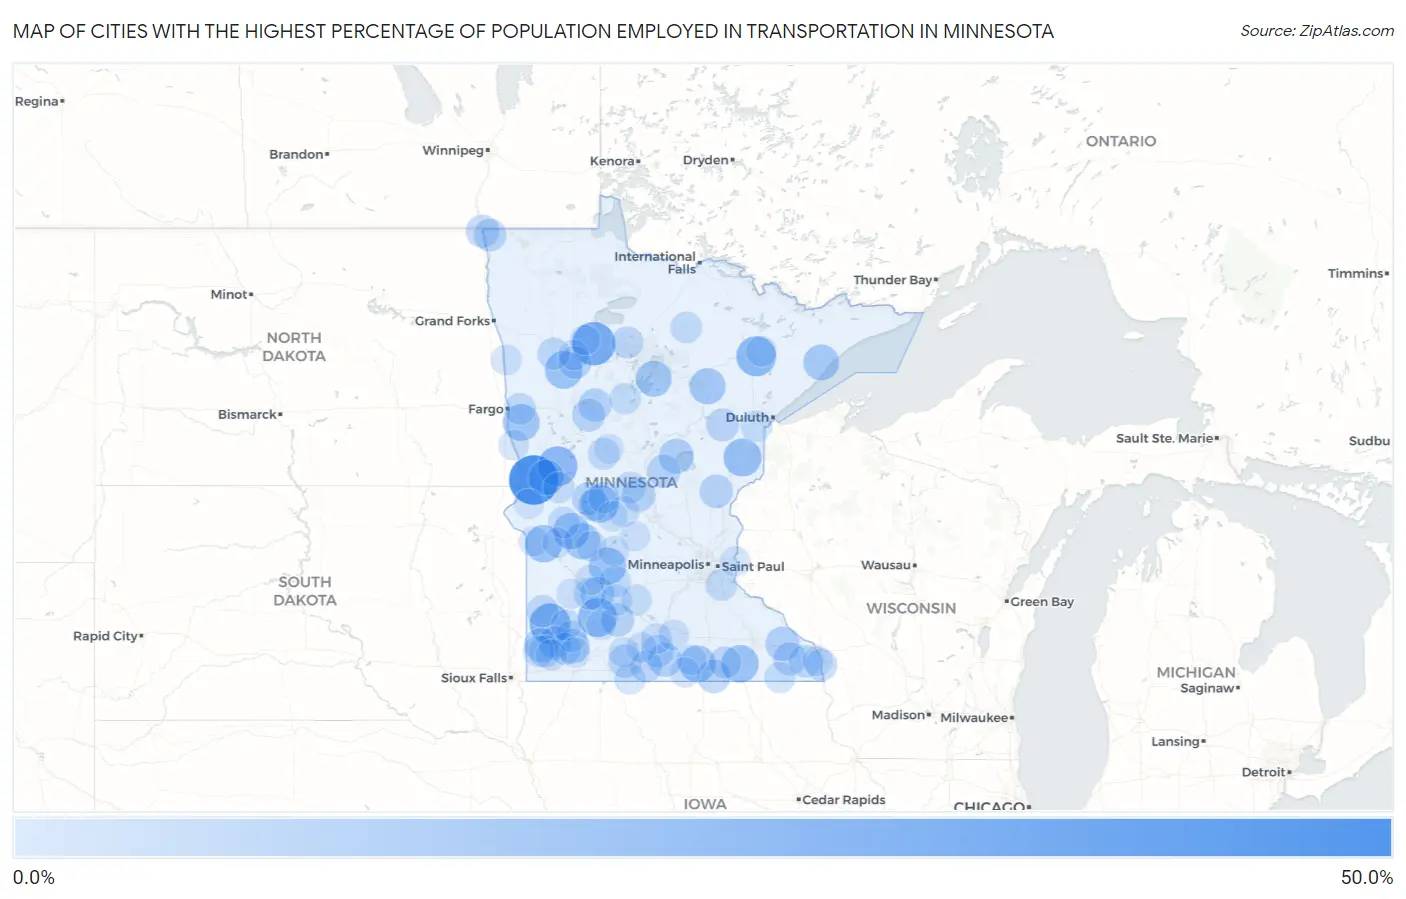
Cities with the Highest Percentage of Population Employed in Transportation in Minnesota
| City | % Employed | vs State | vs National | |
| 1. | Tintah | 44.8% | 3.5% (+41.4)#1 | 3.8% (+41.0)#136 |
| 2. | Leonard | 33.3% | 3.5% (+29.9)#2 | 3.8% (+29.5)#284 |
| 3. | Florence | 28.6% | 3.5% (+25.1)#3 | 3.8% (+24.8)#377 |
| 4. | Mckinley | 26.9% | 3.5% (+23.5)#4 | 3.8% (+23.1)#418 |
| 5. | Dalton | 26.7% | 3.5% (+23.3)#5 | 3.8% (+22.9)#426 |
| 6. | Wanda | 25.5% | 3.5% (+22.0)#6 | 3.8% (+21.6)#475 |
| 7. | Bruno | 23.5% | 3.5% (+20.1)#7 | 3.8% (+19.7)#551 |
| 8. | Essig | 22.7% | 3.5% (+19.3)#8 | 3.8% (+18.9)#603 |
| 9. | Beaulieu | 22.7% | 3.5% (+19.3)#9 | 3.8% (+18.9)#605 |
| 10. | Westport | 22.7% | 3.5% (+19.3)#10 | 3.8% (+18.9)#606 |
| 11. | Dexter | 22.6% | 3.5% (+19.2)#11 | 3.8% (+18.8)#610 |
| 12. | Blomkest | 22.5% | 3.5% (+19.1)#12 | 3.8% (+18.7)#616 |
| 13. | Correll | 22.2% | 3.5% (+18.8)#13 | 3.8% (+18.4)#635 |
| 14. | Baker | 21.4% | 3.5% (+18.0)#14 | 3.8% (+17.6)#682 |
| 15. | Manchester | 21.2% | 3.5% (+17.8)#15 | 3.8% (+17.4)#700 |
| 16. | De Graff | 20.5% | 3.5% (+17.0)#16 | 3.8% (+16.6)#757 |
| 17. | Clontarf | 20.5% | 3.5% (+17.0)#17 | 3.8% (+16.6)#758 |
| 18. | Warba | 20.0% | 3.5% (+16.5)#18 | 3.8% (+16.2)#794 |
| 19. | Federal Dam | 20.0% | 3.5% (+16.5)#19 | 3.8% (+16.2)#795 |
| 20. | Finland | 19.7% | 3.5% (+16.2)#20 | 3.8% (+15.9)#830 |
| 21. | Wendell | 19.0% | 3.5% (+15.6)#21 | 3.8% (+15.2)#872 |
| 22. | Garrison | 17.9% | 3.5% (+14.4)#22 | 3.8% (+14.0)#1,019 |
| 23. | Avoca | 17.1% | 3.5% (+13.6)#23 | 3.8% (+13.3)#1,113 |
| 24. | Delhi | 16.7% | 3.5% (+13.2)#24 | 3.8% (+12.8)#1,179 |
| 25. | Hatfield | 16.7% | 3.5% (+13.2)#25 | 3.8% (+12.8)#1,180 |
| 26. | Utica | 16.5% | 3.5% (+13.0)#26 | 3.8% (+12.7)#1,200 |
| 27. | Delavan | 15.9% | 3.5% (+12.4)#27 | 3.8% (+12.1)#1,281 |
| 28. | Harding | 15.5% | 3.5% (+12.1)#28 | 3.8% (+11.7)#1,334 |
| 29. | Elmdale | 15.5% | 3.5% (+12.0)#29 | 3.8% (+11.7)#1,337 |
| 30. | Forada | 15.4% | 3.5% (+11.9)#30 | 3.8% (+11.6)#1,354 |
| 31. | Myrtle | 15.4% | 3.5% (+11.9)#31 | 3.8% (+11.6)#1,359 |
| 32. | Henriette | 15.4% | 3.5% (+11.9)#32 | 3.8% (+11.6)#1,361 |
| 33. | Cobden | 15.4% | 3.5% (+11.9)#33 | 3.8% (+11.6)#1,362 |
| 34. | Osage | 15.2% | 3.5% (+11.7)#34 | 3.8% (+11.4)#1,389 |
| 35. | Peterson | 15.2% | 3.5% (+11.7)#35 | 3.8% (+11.3)#1,399 |
| 36. | Trimont | 15.1% | 3.5% (+11.6)#36 | 3.8% (+11.3)#1,410 |
| 37. | Wolf Lake | 14.9% | 3.5% (+11.4)#37 | 3.8% (+11.1)#1,453 |
| 38. | St Vincent | 14.8% | 3.5% (+11.4)#38 | 3.8% (+11.0)#1,478 |
| 39. | Wright | 14.3% | 3.5% (+10.8)#39 | 3.8% (+10.5)#1,575 |
| 40. | Humboldt | 14.3% | 3.5% (+10.8)#40 | 3.8% (+10.5)#1,584 |
| 41. | Pine Bend | 14.3% | 3.5% (+10.8)#41 | 3.8% (+10.5)#1,585 |
| 42. | Lake Wilson | 14.2% | 3.5% (+10.7)#42 | 3.8% (+10.3)#1,605 |
| 43. | Amboy | 14.1% | 3.5% (+10.6)#43 | 3.8% (+10.2)#1,626 |
| 44. | Houston | 13.9% | 3.5% (+10.4)#44 | 3.8% (+10.1)#1,667 |
| 45. | Winger | 13.4% | 3.5% (+9.96)#45 | 3.8% (+9.60)#1,781 |
| 46. | Edgerton | 13.4% | 3.5% (+9.91)#46 | 3.8% (+9.55)#1,796 |
| 47. | Arco | 13.3% | 3.5% (+9.88)#47 | 3.8% (+9.52)#1,809 |
| 48. | Lansing | 13.2% | 3.5% (+9.76)#48 | 3.8% (+9.39)#1,838 |
| 49. | Granada | 13.1% | 3.5% (+9.63)#49 | 3.8% (+9.27)#1,869 |
| 50. | Belview | 13.0% | 3.5% (+9.56)#50 | 3.8% (+9.20)#1,888 |
| 51. | Tenstrike | 12.9% | 3.5% (+9.48)#51 | 3.8% (+9.11)#1,911 |
| 52. | Brownsville | 12.9% | 3.5% (+9.45)#52 | 3.8% (+9.09)#1,917 |
| 53. | Villard | 12.8% | 3.5% (+9.37)#53 | 3.8% (+9.00)#1,945 |
| 54. | Hewitt | 12.8% | 3.5% (+9.35)#54 | 3.8% (+8.98)#1,954 |
| 55. | Iona | 12.5% | 3.5% (+9.05)#55 | 3.8% (+8.68)#2,043 |
| 56. | Glyndon | 12.4% | 3.5% (+8.97)#56 | 3.8% (+8.60)#2,080 |
| 57. | Swanville | 12.3% | 3.5% (+8.83)#57 | 3.8% (+8.46)#2,127 |
| 58. | Hancock | 12.2% | 3.5% (+8.79)#58 | 3.8% (+8.43)#2,138 |
| 59. | Effie | 12.2% | 3.5% (+8.79)#59 | 3.8% (+8.43)#2,144 |
| 60. | West Union | 12.2% | 3.5% (+8.74)#60 | 3.8% (+8.38)#2,161 |
| 61. | Coates | 12.2% | 3.5% (+8.71)#61 | 3.8% (+8.35)#2,171 |
| 62. | Bird Island | 12.0% | 3.5% (+8.58)#62 | 3.8% (+8.21)#2,224 |
| 63. | Trosky | 11.9% | 3.5% (+8.45)#63 | 3.8% (+8.09)#2,269 |
| 64. | Carlton | 11.8% | 3.5% (+8.35)#64 | 3.8% (+7.98)#2,310 |
| 65. | Akeley | 11.8% | 3.5% (+8.31)#65 | 3.8% (+7.95)#2,322 |
| 66. | Currie | 11.8% | 3.5% (+8.31)#66 | 3.8% (+7.95)#2,325 |
| 67. | Barrett | 11.7% | 3.5% (+8.28)#67 | 3.8% (+7.91)#2,343 |
| 68. | Franklin | 11.6% | 3.5% (+8.15)#68 | 3.8% (+7.78)#2,386 |
| 69. | New Munich | 11.4% | 3.5% (+7.96)#69 | 3.8% (+7.59)#2,472 |
| 70. | Gibbon | 11.4% | 3.5% (+7.93)#70 | 3.8% (+7.57)#2,483 |
| 71. | Garden City | 11.3% | 3.5% (+7.84)#71 | 3.8% (+7.47)#2,519 |
| 72. | Harmony | 11.2% | 3.5% (+7.79)#72 | 3.8% (+7.43)#2,536 |
| 73. | Ceylon | 11.2% | 3.5% (+7.75)#73 | 3.8% (+7.39)#2,552 |
| 74. | Leota | 11.1% | 3.5% (+7.66)#74 | 3.8% (+7.29)#2,592 |
| 75. | Garvin | 11.1% | 3.5% (+7.66)#75 | 3.8% (+7.29)#2,596 |
| 76. | St Anthony City Stearns County | 11.1% | 3.5% (+7.66)#76 | 3.8% (+7.29)#2,600 |
| 77. | Biwabik | 10.9% | 3.5% (+7.48)#77 | 3.8% (+7.11)#2,669 |
| 78. | St Clair | 10.9% | 3.5% (+7.44)#78 | 3.8% (+7.07)#2,683 |
| 79. | Odin | 10.8% | 3.5% (+7.32)#79 | 3.8% (+6.95)#2,732 |
| 80. | Shelly | 10.7% | 3.5% (+7.26)#80 | 3.8% (+6.90)#2,747 |
| 81. | Lengby | 10.5% | 3.5% (+7.07)#81 | 3.8% (+6.71)#2,842 |
| 82. | Kent | 10.5% | 3.5% (+7.07)#82 | 3.8% (+6.71)#2,845 |
| 83. | Kerkhoven | 10.5% | 3.5% (+7.03)#83 | 3.8% (+6.66)#2,853 |
| 84. | Elrosa | 10.5% | 3.5% (+7.02)#84 | 3.8% (+6.66)#2,857 |
| 85. | Kandiyohi | 10.5% | 3.5% (+7.02)#85 | 3.8% (+6.65)#2,860 |
| 86. | Lewisville | 10.4% | 3.5% (+6.93)#86 | 3.8% (+6.56)#2,913 |
| 87. | Hokah | 10.2% | 3.5% (+6.75)#87 | 3.8% (+6.38)#3,020 |
| 88. | Sacred Heart | 10.2% | 3.5% (+6.72)#88 | 3.8% (+6.36)#3,029 |
| 89. | Freeborn | 10.1% | 3.5% (+6.63)#89 | 3.8% (+6.27)#3,073 |
| 90. | Odessa | 10.0% | 3.5% (+6.55)#90 | 3.8% (+6.18)#3,126 |
| 91. | Walters | 10.0% | 3.5% (+6.55)#91 | 3.8% (+6.18)#3,132 |
| 92. | Holloway | 10.0% | 3.5% (+6.55)#92 | 3.8% (+6.18)#3,133 |
| 93. | Clearbrook | 9.9% | 3.5% (+6.47)#93 | 3.8% (+6.10)#3,178 |
| 94. | Bayport | 9.9% | 3.5% (+6.46)#94 | 3.8% (+6.09)#3,184 |
| 95. | Cottonwood | 9.7% | 3.5% (+6.25)#95 | 3.8% (+5.89)#3,313 |
| 96. | Fulda | 9.7% | 3.5% (+6.25)#96 | 3.8% (+5.88)#3,315 |
| 97. | Eden Valley | 9.7% | 3.5% (+6.24)#97 | 3.8% (+5.87)#3,323 |
| 98. | Sanborn | 9.6% | 3.5% (+6.19)#98 | 3.8% (+5.82)#3,348 |
| 99. | Verndale | 9.6% | 3.5% (+6.14)#99 | 3.8% (+5.78)#3,384 |
| 100. | Dumont | 9.6% | 3.5% (+6.12)#100 | 3.8% (+5.76)#3,402 |
Common Questions
What are the Top 10 Cities with the Highest Percentage of Population Employed in Transportation in Minnesota?
Top 10 Cities with the Highest Percentage of Population Employed in Transportation in Minnesota are:
What city has the Highest Percentage of Population Employed in Transportation in Minnesota?
Tintah has the Highest Percentage of Population Employed in Transportation in Minnesota with 44.8%.
What is the Percentage of Population Employed in Transportation in the State of Minnesota?
Percentage of Population Employed in Transportation in Minnesota is 3.5%.
What is the Percentage of Population Employed in Transportation in the United States?
Percentage of Population Employed in Transportation in the United States is 3.8%.