Cities with the Highest Percentage of Population Employed in Transportation in Virginia
RELATED REPORTS & OPTIONS
Transportation
Virginia
Compare Cities
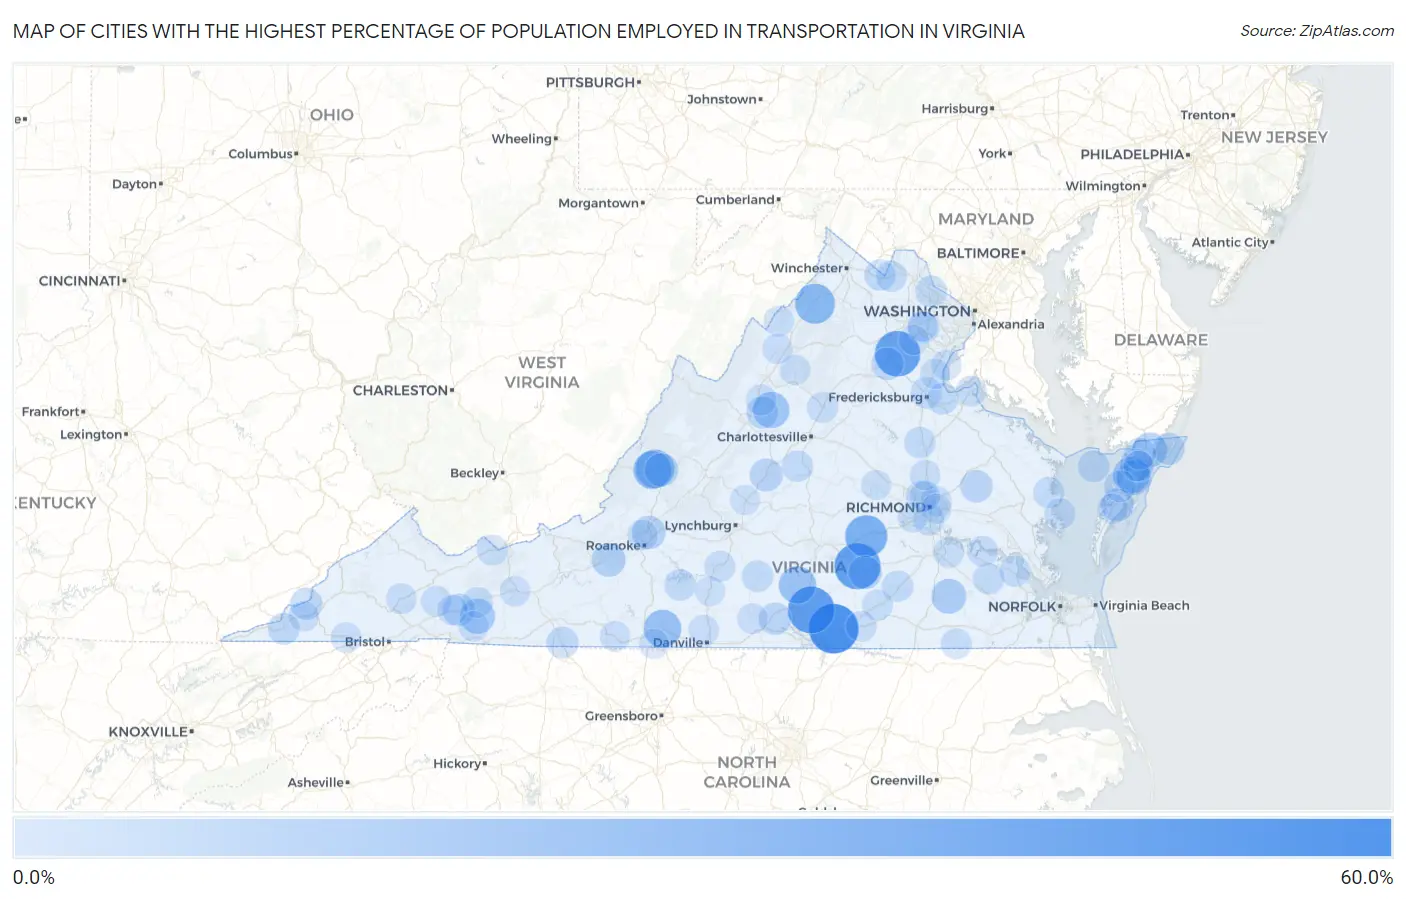
Map of Cities with the Highest Percentage of Population Employed in Transportation in Virginia
0.0%
60.0%
Cities with the Highest Percentage of Population Employed in Transportation in Virginia
| City | % Employed | vs State | vs National | |
| 1. | Baskerville | 60.0% | 3.4%(+56.6)#1 | 3.8%(+56.2)#52 |
| 2. | Thynedale | 52.0% | 3.4%(+48.6)#2 | 3.8%(+48.2)#85 |
| 3. | Nottoway Court House | 50.0% | 3.4%(+46.6)#3 | 3.8%(+46.2)#94 |
| 4. | Midland | 48.7% | 3.4%(+45.3)#4 | 3.8%(+44.9)#108 |
| 5. | Amelia Court House | 39.1% | 3.4%(+35.7)#5 | 3.8%(+35.3)#181 |
| 6. | Toms Brook | 32.8% | 3.4%(+29.4)#6 | 3.8%(+29.0)#290 |
| 7. | Selma | 28.8% | 3.4%(+25.4)#7 | 3.8%(+25.0)#366 |
| 8. | Pounding Mill | 28.0% | 3.4%(+24.6)#8 | 3.8%(+24.2)#391 |
| 9. | Low Moor | 27.7% | 3.4%(+24.3)#9 | 3.8%(+23.9)#400 |
| 10. | Laurel Park | 26.6% | 3.4%(+23.2)#10 | 3.8%(+22.8)#431 |
| 11. | Drakes Branch | 25.7% | 3.4%(+22.3)#11 | 3.8%(+21.8)#469 |
| 12. | Harriston | 23.0% | 3.4%(+19.6)#12 | 3.8%(+19.2)#585 |
| 13. | Chase Crossing | 22.9% | 3.4%(+19.5)#13 | 3.8%(+19.1)#589 |
| 14. | Allison Gap | 19.9% | 3.4%(+16.5)#14 | 3.8%(+16.0)#818 |
| 15. | Sugar Grove | 19.4% | 3.4%(+16.0)#15 | 3.8%(+15.6)#850 |
| 16. | Pastoria | 19.0% | 3.4%(+15.6)#16 | 3.8%(+15.2)#880 |
| 17. | Sussex | 18.5% | 3.4%(+15.1)#17 | 3.8%(+14.7)#927 |
| 18. | Wattsville | 18.5% | 3.4%(+15.1)#18 | 3.8%(+14.7)#935 |
| 19. | Bastian | 15.7% | 3.4%(+12.3)#19 | 3.8%(+11.8)#1,304 |
| 20. | Shawsville | 15.6% | 3.4%(+12.2)#20 | 3.8%(+11.8)#1,310 |
| 21. | Iron Gate | 15.2% | 3.4%(+11.7)#21 | 3.8%(+11.3)#1,398 |
| 22. | Cloverdale | 15.1% | 3.4%(+11.7)#22 | 3.8%(+11.3)#1,413 |
| 23. | Blackstone | 14.8% | 3.4%(+11.4)#23 | 3.8%(+11.0)#1,486 |
| 24. | Lovingston | 13.7% | 3.4%(+10.3)#24 | 3.8%(+9.91)#1,696 |
| 25. | Cats Bridge | 13.6% | 3.4%(+10.2)#25 | 3.8%(+9.74)#1,740 |
| 26. | Mcmullin | 12.8% | 3.4%(+9.43)#26 | 3.8%(+9.02)#1,944 |
| 27. | Remington | 12.6% | 3.4%(+9.24)#27 | 3.8%(+8.83)#2,002 |
| 28. | Bloxom | 12.6% | 3.4%(+9.24)#28 | 3.8%(+8.83)#2,003 |
| 29. | King William | 12.3% | 3.4%(+8.94)#29 | 3.8%(+8.53)#2,105 |
| 30. | Scottsburg | 12.1% | 3.4%(+8.66)#30 | 3.8%(+8.25)#2,206 |
| 31. | Chincoteague | 11.4% | 3.4%(+8.04)#31 | 3.8%(+7.62)#2,453 |
| 32. | Keokee | 11.2% | 3.4%(+7.82)#32 | 3.8%(+7.41)#2,545 |
| 33. | New Hope | 11.1% | 3.4%(+7.74)#33 | 3.8%(+7.33)#2,567 |
| 34. | Makemie Park | 10.9% | 3.4%(+7.47)#34 | 3.8%(+7.05)#2,701 |
| 35. | Tangier | 10.8% | 3.4%(+7.35)#35 | 3.8%(+6.94)#2,735 |
| 36. | Savageville | 10.6% | 3.4%(+7.21)#36 | 3.8%(+6.79)#2,792 |
| 37. | Keezletown | 10.5% | 3.4%(+7.07)#37 | 3.8%(+6.66)#2,856 |
| 38. | Jonesville | 10.4% | 3.4%(+7.03)#38 | 3.8%(+6.61)#2,877 |
| 39. | Cana | 10.4% | 3.4%(+6.98)#39 | 3.8%(+6.57)#2,909 |
| 40. | Loch Lomond | 10.0% | 3.4%(+6.59)#40 | 3.8%(+6.18)#3,143 |
| 41. | Brookneal | 10.0% | 3.4%(+6.57)#41 | 3.8%(+6.16)#3,145 |
| 42. | Dulles Town Center | 9.9% | 3.4%(+6.54)#42 | 3.8%(+6.13)#3,161 |
| 43. | Meadowview | 9.9% | 3.4%(+6.52)#43 | 3.8%(+6.11)#3,173 |
| 44. | Falmouth | 9.6% | 3.4%(+6.23)#44 | 3.8%(+5.82)#3,352 |
| 45. | Millboro | 9.6% | 3.4%(+6.21)#45 | 3.8%(+5.80)#3,371 |
| 46. | Lake Caroline | 9.6% | 3.4%(+6.17)#46 | 3.8%(+5.76)#3,404 |
| 47. | Shenandoah Retreat | 9.5% | 3.4%(+6.09)#47 | 3.8%(+5.68)#3,454 |
| 48. | Esmont | 9.5% | 3.4%(+6.08)#48 | 3.8%(+5.67)#3,461 |
| 49. | Dendron | 9.4% | 3.4%(+6.04)#49 | 3.8%(+5.63)#3,481 |
| 50. | Passapatanzy | 9.4% | 3.4%(+6.04)#50 | 3.8%(+5.63)#3,483 |
| 51. | Penhook | 9.4% | 3.4%(+5.96)#51 | 3.8%(+5.55)#3,537 |
| 52. | Mckenney | 9.3% | 3.4%(+5.92)#52 | 3.8%(+5.51)#3,560 |
| 53. | Bensley | 8.9% | 3.4%(+5.50)#53 | 3.8%(+5.08)#3,902 |
| 54. | Dumbarton | 8.9% | 3.4%(+5.46)#54 | 3.8%(+5.04)#3,942 |
| 55. | Rushmere | 8.8% | 3.4%(+5.43)#55 | 3.8%(+5.02)#3,951 |
| 56. | White Stone | 8.8% | 3.4%(+5.40)#56 | 3.8%(+4.99)#3,979 |
| 57. | Round Hill | 8.8% | 3.4%(+5.38)#57 | 3.8%(+4.96)#3,999 |
| 58. | Atkins | 8.7% | 3.4%(+5.28)#58 | 3.8%(+4.87)#4,091 |
| 59. | Weyers Cave | 8.4% | 3.4%(+4.99)#59 | 3.8%(+4.57)#4,369 |
| 60. | North Garden | 8.4% | 3.4%(+4.97)#60 | 3.8%(+4.56)#4,383 |
| 61. | Ruckersville | 8.3% | 3.4%(+4.93)#61 | 3.8%(+4.52)#4,409 |
| 62. | Altavista | 8.2% | 3.4%(+4.82)#62 | 3.8%(+4.41)#4,552 |
| 63. | Linville | 8.2% | 3.4%(+4.79)#63 | 3.8%(+4.38)#4,582 |
| 64. | Gwynn | 8.2% | 3.4%(+4.79)#64 | 3.8%(+4.37)#4,590 |
| 65. | Bluefield | 8.1% | 3.4%(+4.74)#65 | 3.8%(+4.33)#4,629 |
| 66. | Dahlgren | 8.1% | 3.4%(+4.71)#66 | 3.8%(+4.30)#4,648 |
| 67. | Prince George | 8.0% | 3.4%(+4.58)#67 | 3.8%(+4.16)#4,787 |
| 68. | Lebanon | 7.9% | 3.4%(+4.54)#68 | 3.8%(+4.12)#4,812 |
| 69. | Nelsonia | 7.8% | 3.4%(+4.43)#69 | 3.8%(+4.01)#4,926 |
| 70. | Saltville | 7.8% | 3.4%(+4.39)#70 | 3.8%(+3.98)#4,969 |
| 71. | East Highland Park | 7.8% | 3.4%(+4.35)#71 | 3.8%(+3.94)#5,014 |
| 72. | Boykins | 7.7% | 3.4%(+4.32)#72 | 3.8%(+3.91)#5,048 |
| 73. | Claremont | 7.7% | 3.4%(+4.29)#73 | 3.8%(+3.88)#5,081 |
| 74. | Alberta | 7.7% | 3.4%(+4.29)#74 | 3.8%(+3.88)#5,087 |
| 75. | Brodnax | 7.7% | 3.4%(+4.25)#75 | 3.8%(+3.84)#5,147 |
| 76. | Lakeside | 7.6% | 3.4%(+4.21)#76 | 3.8%(+3.80)#5,184 |
| 77. | Mountain Road | 7.5% | 3.4%(+4.08)#77 | 3.8%(+3.67)#5,336 |
| 78. | Seven Mile Ford | 7.4% | 3.4%(+4.03)#78 | 3.8%(+3.62)#5,388 |
| 79. | Weber City | 7.4% | 3.4%(+3.99)#79 | 3.8%(+3.57)#5,457 |
| 80. | Basye | 7.3% | 3.4%(+3.94)#80 | 3.8%(+3.53)#5,511 |
| 81. | Patrick Springs | 7.3% | 3.4%(+3.93)#81 | 3.8%(+3.51)#5,528 |
| 82. | Mount Hermon | 7.2% | 3.4%(+3.76)#82 | 3.8%(+3.35)#5,736 |
| 83. | Shenandoah | 7.1% | 3.4%(+3.73)#83 | 3.8%(+3.32)#5,813 |
| 84. | Quantico | 7.1% | 3.4%(+3.68)#84 | 3.8%(+3.26)#5,876 |
| 85. | Dryden | 7.0% | 3.4%(+3.63)#85 | 3.8%(+3.21)#5,930 |
| 86. | Sudley | 7.0% | 3.4%(+3.60)#86 | 3.8%(+3.19)#5,949 |
| 87. | Ashland | 7.0% | 3.4%(+3.59)#87 | 3.8%(+3.18)#5,969 |
| 88. | Timberville | 6.9% | 3.4%(+3.54)#88 | 3.8%(+3.12)#6,046 |
| 89. | Exmore | 6.9% | 3.4%(+3.50)#89 | 3.8%(+3.09)#6,099 |
| 90. | Hollins | 6.9% | 3.4%(+3.46)#90 | 3.8%(+3.05)#6,161 |
| 91. | Troutdale | 6.8% | 3.4%(+3.45)#91 | 3.8%(+3.03)#6,188 |
| 92. | Wytheville | 6.7% | 3.4%(+3.32)#92 | 3.8%(+2.91)#6,376 |
| 93. | Goochland | 6.7% | 3.4%(+3.28)#93 | 3.8%(+2.86)#6,431 |
| 94. | Aquia Harbour | 6.6% | 3.4%(+3.15)#94 | 3.8%(+2.74)#6,651 |
| 95. | Amherst | 6.4% | 3.4%(+2.99)#95 | 3.8%(+2.58)#6,892 |
| 96. | Gretna | 6.4% | 3.4%(+2.97)#96 | 3.8%(+2.56)#6,925 |
| 97. | Ridgeway | 6.4% | 3.4%(+2.96)#97 | 3.8%(+2.54)#6,948 |
| 98. | Rockwood | 6.2% | 3.4%(+2.83)#98 | 3.8%(+2.42)#7,199 |
| 99. | Montrose | 6.2% | 3.4%(+2.82)#99 | 3.8%(+2.41)#7,205 |
| 100. | Nokesville | 6.2% | 3.4%(+2.78)#100 | 3.8%(+2.37)#7,282 |
Common Questions
What are the Top 10 Cities with the Highest Percentage of Population Employed in Transportation in Virginia?
Top 10 Cities with the Highest Percentage of Population Employed in Transportation in Virginia are:
#1
60.0%
#2
52.0%
#3
50.0%
#4
48.7%
#5
39.1%
#6
32.8%
#7
28.8%
#8
27.7%
#9
26.6%
#10
25.7%
What city has the Highest Percentage of Population Employed in Transportation in Virginia?
Baskerville has the Highest Percentage of Population Employed in Transportation in Virginia with 60.0%.
What is the Percentage of Population Employed in Transportation in the State of Virginia?
Percentage of Population Employed in Transportation in Virginia is 3.4%.
What is the Percentage of Population Employed in Transportation in the United States?
Percentage of Population Employed in Transportation in the United States is 3.8%.