Cities with the Highest Percentage of Population Employed in Transportation in Oklahoma
RELATED REPORTS & OPTIONS
Transportation
Oklahoma
Compare Cities
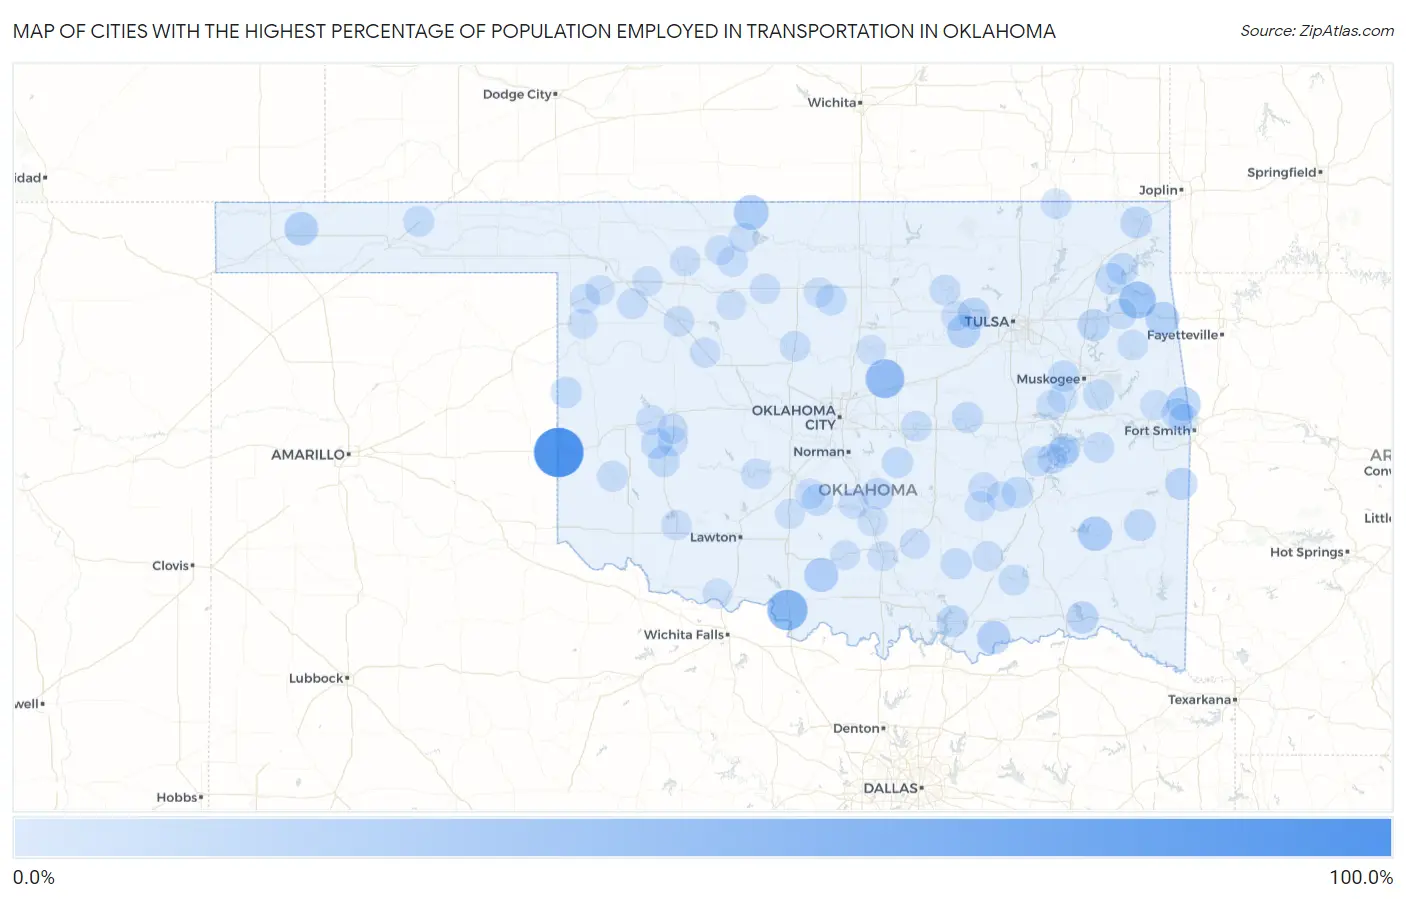
Map of Cities with the Highest Percentage of Population Employed in Transportation in Oklahoma
0.0%
100.0%
Cities with the Highest Percentage of Population Employed in Transportation in Oklahoma
| City | % Employed | vs State | vs National | |
| 1. | Texola | 100.0% | 3.7%(+96.3)#1 | 3.8%(+96.2)#19 |
| 2. | Durham | 70.0% | 3.7%(+66.3)#2 | 3.8%(+66.2)#39 |
| 3. | Sugden | 56.2% | 3.7%(+52.5)#3 | 3.8%(+52.4)#60 |
| 4. | Fallis | 48.4% | 3.7%(+44.7)#4 | 3.8%(+44.6)#111 |
| 5. | Bull Hollow | 40.4% | 3.7%(+36.7)#5 | 3.8%(+36.6)#167 |
| 6. | Olive | 36.4% | 3.7%(+32.6)#6 | 3.8%(+32.5)#218 |
| 7. | Amorita | 30.8% | 3.7%(+27.0)#7 | 3.8%(+27.0)#319 |
| 8. | Tuskahoma | 28.6% | 3.7%(+24.8)#8 | 3.8%(+24.8)#371 |
| 9. | Loco | 27.3% | 3.7%(+23.5)#9 | 3.8%(+23.5)#412 |
| 10. | Short | 26.3% | 3.7%(+22.6)#10 | 3.8%(+22.5)#441 |
| 11. | Dripping Springs | 26.1% | 3.7%(+22.4)#11 | 3.8%(+22.3)#456 |
| 12. | Keyes | 25.7% | 3.7%(+22.0)#12 | 3.8%(+21.9)#465 |
| 13. | Albany | 24.0% | 3.7%(+20.3)#13 | 3.8%(+20.2)#528 |
| 14. | Hennepin | 23.2% | 3.7%(+19.4)#14 | 3.8%(+19.4)#574 |
| 15. | Lawrence Creek | 23.1% | 3.7%(+19.3)#15 | 3.8%(+19.3)#577 |
| 16. | Lakeside | 21.4% | 3.7%(+17.7)#16 | 3.8%(+17.6)#677 |
| 17. | Watova | 19.2% | 3.7%(+15.5)#17 | 3.8%(+15.4)#860 |
| 18. | Oak Grove | 18.9% | 3.7%(+15.2)#18 | 3.8%(+15.1)#886 |
| 19. | Canadian Shores | 18.8% | 3.7%(+15.1)#19 | 3.8%(+15.0)#892 |
| 20. | Sawyer | 18.6% | 3.7%(+14.8)#20 | 3.8%(+14.8)#919 |
| 21. | Monroe | 18.2% | 3.7%(+14.4)#21 | 3.8%(+14.4)#977 |
| 22. | Pin Oak Acres | 18.0% | 3.7%(+14.2)#22 | 3.8%(+14.1)#1,007 |
| 23. | Whitesboro | 17.9% | 3.7%(+14.2)#23 | 3.8%(+14.1)#1,010 |
| 24. | Mead | 17.0% | 3.7%(+13.2)#24 | 3.8%(+13.1)#1,125 |
| 25. | Sparrowhawk | 16.9% | 3.7%(+13.2)#25 | 3.8%(+13.1)#1,127 |
| 26. | Dotyville | 16.9% | 3.7%(+13.2)#26 | 3.8%(+13.1)#1,133 |
| 27. | Long | 16.7% | 3.7%(+12.9)#27 | 3.8%(+12.8)#1,159 |
| 28. | Rosedale | 16.7% | 3.7%(+12.9)#28 | 3.8%(+12.8)#1,182 |
| 29. | Bradley | 16.1% | 3.7%(+12.4)#29 | 3.8%(+12.3)#1,247 |
| 30. | Rocky | 15.9% | 3.7%(+12.2)#30 | 3.8%(+12.1)#1,272 |
| 31. | Carlton Landing | 15.8% | 3.7%(+12.1)#31 | 3.8%(+12.0)#1,290 |
| 32. | Castle | 15.4% | 3.7%(+11.7)#32 | 3.8%(+11.6)#1,353 |
| 33. | Taft | 15.4% | 3.7%(+11.7)#33 | 3.8%(+11.6)#1,357 |
| 34. | Ketchum | 15.2% | 3.7%(+11.5)#34 | 3.8%(+11.4)#1,383 |
| 35. | Pensacola | 15.2% | 3.7%(+11.5)#35 | 3.8%(+11.4)#1,386 |
| 36. | Arpelar | 15.2% | 3.7%(+11.4)#36 | 3.8%(+11.4)#1,392 |
| 37. | Reydon | 14.9% | 3.7%(+11.1)#37 | 3.8%(+11.0)#1,458 |
| 38. | Macomb | 14.3% | 3.7%(+10.6)#38 | 3.8%(+10.5)#1,587 |
| 39. | Dill City | 14.2% | 3.7%(+10.5)#39 | 3.8%(+10.4)#1,599 |
| 40. | Bromide | 14.0% | 3.7%(+10.2)#40 | 3.8%(+10.1)#1,651 |
| 41. | Rocky Point | 13.7% | 3.7%(+10.0)#41 | 3.8%(+9.92)#1,693 |
| 42. | River Bottom | 13.6% | 3.7%(+9.90)#42 | 3.8%(+9.82)#1,721 |
| 43. | Golden | 13.6% | 3.7%(+9.90)#43 | 3.8%(+9.82)#1,726 |
| 44. | Covington | 13.5% | 3.7%(+9.77)#44 | 3.8%(+9.68)#1,748 |
| 45. | Hooker | 13.5% | 3.7%(+9.74)#45 | 3.8%(+9.65)#1,757 |
| 46. | Willow | 13.4% | 3.7%(+9.66)#46 | 3.8%(+9.58)#1,788 |
| 47. | Rose | 13.3% | 3.7%(+9.60)#47 | 3.8%(+9.52)#1,802 |
| 48. | Blackburn | 12.9% | 3.7%(+9.17)#48 | 3.8%(+9.09)#1,925 |
| 49. | Lane | 12.7% | 3.7%(+8.99)#49 | 3.8%(+8.91)#1,979 |
| 50. | Leonard | 12.7% | 3.7%(+8.96)#50 | 3.8%(+8.88)#1,992 |
| 51. | Sharon | 12.6% | 3.7%(+8.91)#51 | 3.8%(+8.83)#2,006 |
| 52. | Whitefield | 12.6% | 3.7%(+8.84)#52 | 3.8%(+8.75)#2,025 |
| 53. | Hodgen | 12.5% | 3.7%(+8.77)#53 | 3.8%(+8.68)#2,057 |
| 54. | Carmen | 12.4% | 3.7%(+8.67)#54 | 3.8%(+8.59)#2,085 |
| 55. | Keefton | 12.3% | 3.7%(+8.59)#55 | 3.8%(+8.51)#2,108 |
| 56. | Longtown | 12.3% | 3.7%(+8.56)#56 | 3.8%(+8.48)#2,121 |
| 57. | Milfay | 12.2% | 3.7%(+8.51)#57 | 3.8%(+8.43)#2,143 |
| 58. | Dover | 12.2% | 3.7%(+8.48)#58 | 3.8%(+8.40)#2,153 |
| 59. | Seiling | 12.2% | 3.7%(+8.47)#59 | 3.8%(+8.39)#2,156 |
| 60. | Johnson | 12.1% | 3.7%(+8.34)#60 | 3.8%(+8.26)#2,200 |
| 61. | Pickett | 12.0% | 3.7%(+8.25)#61 | 3.8%(+8.17)#2,239 |
| 62. | Meno | 11.9% | 3.7%(+8.15)#62 | 3.8%(+8.07)#2,274 |
| 63. | Anadarko | 11.9% | 3.7%(+8.15)#63 | 3.8%(+8.07)#2,276 |
| 64. | Alex | 11.7% | 3.7%(+8.01)#64 | 3.8%(+7.92)#2,339 |
| 65. | New Cordell | 11.7% | 3.7%(+7.97)#65 | 3.8%(+7.88)#2,349 |
| 66. | Hickory | 11.7% | 3.7%(+7.93)#66 | 3.8%(+7.85)#2,361 |
| 67. | Foss | 11.6% | 3.7%(+7.89)#67 | 3.8%(+7.81)#2,374 |
| 68. | Gerty | 11.5% | 3.7%(+7.80)#68 | 3.8%(+7.72)#2,419 |
| 69. | Oakwood | 11.4% | 3.7%(+7.69)#69 | 3.8%(+7.61)#2,467 |
| 70. | South Coffeyville | 11.4% | 3.7%(+7.66)#70 | 3.8%(+7.58)#2,478 |
| 71. | Maysville | 11.3% | 3.7%(+7.58)#71 | 3.8%(+7.50)#2,509 |
| 72. | Lehigh | 11.2% | 3.7%(+7.50)#72 | 3.8%(+7.42)#2,541 |
| 73. | Calvin | 11.2% | 3.7%(+7.47)#73 | 3.8%(+7.38)#2,557 |
| 74. | Mountain Park | 11.2% | 3.7%(+7.47)#74 | 3.8%(+7.38)#2,558 |
| 75. | Canadian | 11.1% | 3.7%(+7.38)#75 | 3.8%(+7.29)#2,586 |
| 76. | Terlton | 11.1% | 3.7%(+7.38)#76 | 3.8%(+7.29)#2,601 |
| 77. | Steely Hollow | 11.0% | 3.7%(+7.24)#77 | 3.8%(+7.16)#2,651 |
| 78. | Waynoka | 10.9% | 3.7%(+7.14)#78 | 3.8%(+7.06)#2,692 |
| 79. | Crescent Springs | 10.9% | 3.7%(+7.14)#79 | 3.8%(+7.05)#2,698 |
| 80. | Indianola | 10.8% | 3.7%(+7.08)#80 | 3.8%(+6.99)#2,721 |
| 81. | Gage | 10.5% | 3.7%(+6.79)#81 | 3.8%(+6.71)#2,828 |
| 82. | Bessie | 10.5% | 3.7%(+6.79)#82 | 3.8%(+6.71)#2,832 |
| 83. | Pauls Valley | 10.4% | 3.7%(+6.63)#83 | 3.8%(+6.55)#2,922 |
| 84. | Fargo | 10.3% | 3.7%(+6.59)#84 | 3.8%(+6.51)#2,953 |
| 85. | Fairview | 10.3% | 3.7%(+6.57)#85 | 3.8%(+6.49)#2,960 |
| 86. | Arnett | 10.3% | 3.7%(+6.57)#86 | 3.8%(+6.48)#2,961 |
| 87. | Brushy | 10.3% | 3.7%(+6.56)#87 | 3.8%(+6.47)#2,969 |
| 88. | Stuart | 10.3% | 3.7%(+6.52)#88 | 3.8%(+6.44)#2,986 |
| 89. | Wainwright | 10.3% | 3.7%(+6.52)#89 | 3.8%(+6.44)#2,988 |
| 90. | Dacoma | 10.2% | 3.7%(+6.47)#90 | 3.8%(+6.39)#3,017 |
| 91. | Mooreland | 10.1% | 3.7%(+6.38)#91 | 3.8%(+6.29)#3,056 |
| 92. | Fairmont | 10.0% | 3.7%(+6.27)#92 | 3.8%(+6.18)#3,119 |
| 93. | Council Hill | 10.0% | 3.7%(+6.27)#93 | 3.8%(+6.18)#3,130 |
| 94. | Devol | 9.9% | 3.7%(+6.13)#94 | 3.8%(+6.04)#3,215 |
| 95. | Rush Springs | 9.8% | 3.7%(+6.09)#95 | 3.8%(+6.01)#3,227 |
| 96. | Davis | 9.8% | 3.7%(+6.02)#96 | 3.8%(+5.94)#3,266 |
| 97. | Tatums | 9.8% | 3.7%(+6.02)#97 | 3.8%(+5.94)#3,271 |
| 98. | Cherokee | 9.7% | 3.7%(+5.96)#98 | 3.8%(+5.88)#3,317 |
| 99. | Remy | 9.7% | 3.7%(+5.96)#99 | 3.8%(+5.87)#3,322 |
| 100. | Coyle | 9.7% | 3.7%(+5.94)#100 | 3.8%(+5.86)#3,327 |
Common Questions
What are the Top 10 Cities with the Highest Percentage of Population Employed in Transportation in Oklahoma?
Top 10 Cities with the Highest Percentage of Population Employed in Transportation in Oklahoma are:
#1
100.0%
#2
56.2%
#3
48.4%
#4
40.4%
#5
30.8%
#6
28.6%
#7
27.3%
#8
26.3%
#9
26.1%
#10
25.7%
What city has the Highest Percentage of Population Employed in Transportation in Oklahoma?
Texola has the Highest Percentage of Population Employed in Transportation in Oklahoma with 100.0%.
What is the Percentage of Population Employed in Transportation in the State of Oklahoma?
Percentage of Population Employed in Transportation in Oklahoma is 3.7%.
What is the Percentage of Population Employed in Transportation in the United States?
Percentage of Population Employed in Transportation in the United States is 3.8%.