Cities with the Highest Percentage of Population Employed in Law Enforcement in West Virginia
RELATED REPORTS & OPTIONS
Law Enforcement
West Virginia
Compare Cities
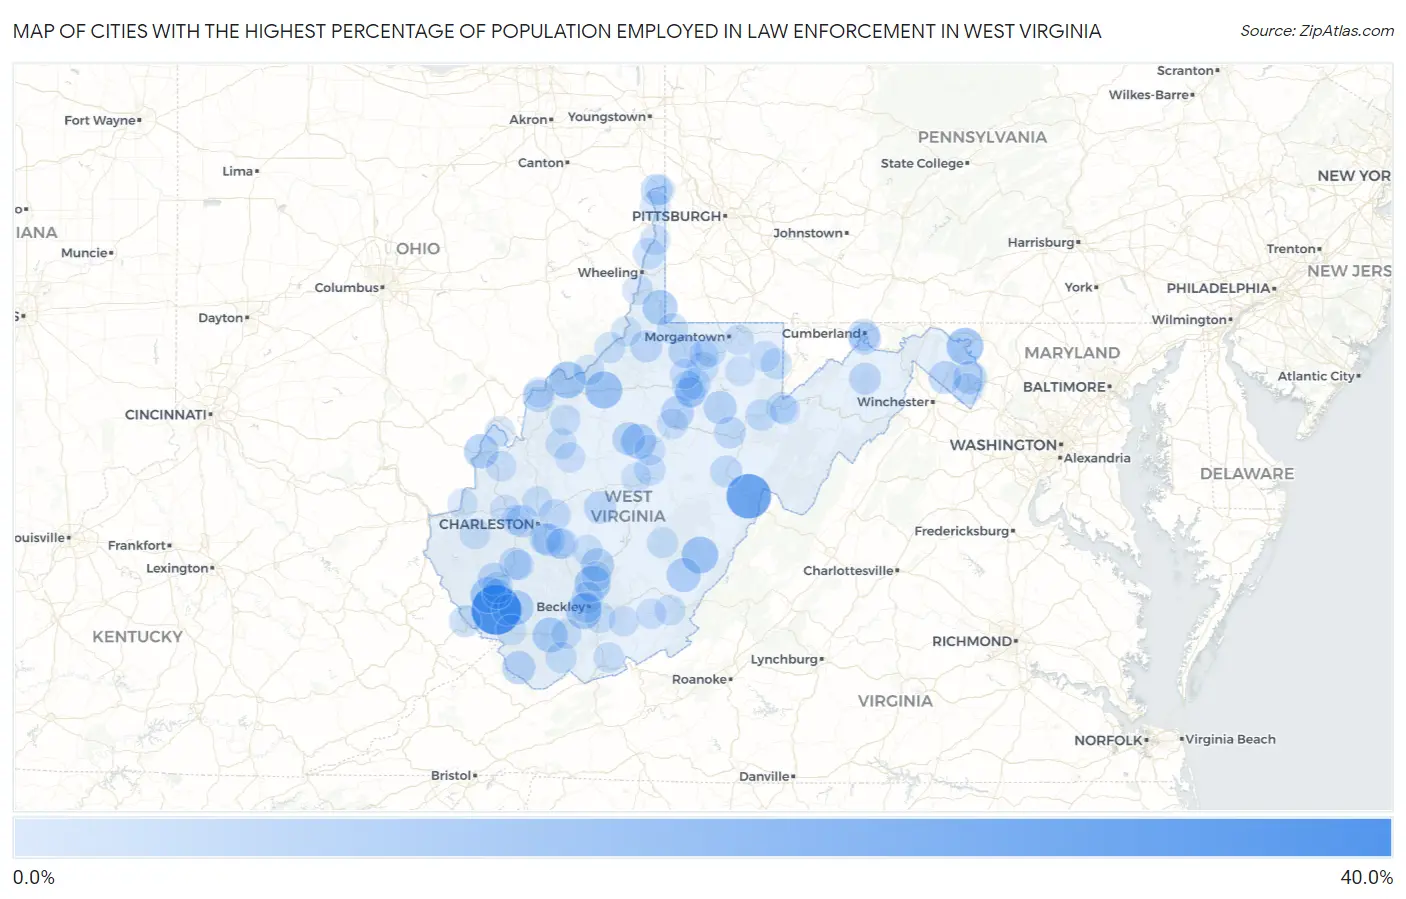
Map of Cities with the Highest Percentage of Population Employed in Law Enforcement in West Virginia
0.0%
40.0%
Cities with the Highest Percentage of Population Employed in Law Enforcement in West Virginia
| City | % Employed | vs State | vs National | |
| 1. | Omar | 36.7% | 1.2%(+35.6)#1 | 0.96%(+35.8)#37 |
| 2. | Bartow | 27.5% | 1.2%(+26.3)#2 | 0.96%(+26.5)#70 |
| 3. | Reynoldsville | 23.0% | 1.2%(+21.8)#3 | 0.96%(+22.0)#108 |
| 4. | Ellenboro | 13.6% | 1.2%(+12.5)#4 | 0.96%(+12.7)#252 |
| 5. | Falling Waters | 13.3% | 1.2%(+12.1)#5 | 0.96%(+12.3)#264 |
| 6. | Waverly | 13.2% | 1.2%(+12.0)#6 | 0.96%(+12.2)#269 |
| 7. | Hillsboro | 13.0% | 1.2%(+11.9)#7 | 0.96%(+12.1)#275 |
| 8. | Verdunville | 12.4% | 1.2%(+11.2)#8 | 0.96%(+11.4)#305 |
| 9. | Hilltop | 11.5% | 1.2%(+10.3)#9 | 0.96%(+10.5)#362 |
| 10. | Crab Orchard | 11.1% | 1.2%(+9.96)#10 | 0.96%(+10.1)#387 |
| 11. | Cameron | 10.1% | 1.2%(+8.90)#11 | 0.96%(+9.10)#466 |
| 12. | Sand Fork | 10.0% | 1.2%(+8.85)#12 | 0.96%(+9.04)#474 |
| 13. | Pineville | 9.8% | 1.2%(+8.65)#13 | 0.96%(+8.84)#485 |
| 14. | Accoville | 9.4% | 1.2%(+8.28)#14 | 0.96%(+8.47)#532 |
| 15. | Point Pleasant | 9.2% | 1.2%(+8.06)#15 | 0.96%(+8.25)#556 |
| 16. | Falling Spring | 8.3% | 1.2%(+7.18)#16 | 0.96%(+7.37)#682 |
| 17. | Shenandoah Junction | 7.5% | 1.2%(+6.33)#17 | 0.96%(+6.52)#823 |
| 18. | Fayetteville | 7.3% | 1.2%(+6.12)#18 | 0.96%(+6.31)#865 |
| 19. | Bradshaw | 6.8% | 1.2%(+5.69)#19 | 0.96%(+5.89)#971 |
| 20. | Philippi | 6.8% | 1.2%(+5.65)#20 | 0.96%(+5.84)#982 |
| 21. | Jane Lew | 6.6% | 1.2%(+5.43)#21 | 0.96%(+5.62)#1,048 |
| 22. | Glenville | 6.5% | 1.2%(+5.39)#22 | 0.96%(+5.58)#1,057 |
| 23. | Mannington | 6.5% | 1.2%(+5.35)#23 | 0.96%(+5.55)#1,069 |
| 24. | Inwood | 6.4% | 1.2%(+5.22)#24 | 0.96%(+5.41)#1,107 |
| 25. | Belle | 6.0% | 1.2%(+4.84)#25 | 0.96%(+5.03)#1,215 |
| 26. | Clay | 5.8% | 1.2%(+4.61)#26 | 0.96%(+4.81)#1,299 |
| 27. | Jefferson | 5.6% | 1.2%(+4.49)#27 | 0.96%(+4.69)#1,345 |
| 28. | Danville | 5.5% | 1.2%(+4.34)#28 | 0.96%(+4.53)#1,408 |
| 29. | Lubeck | 5.2% | 1.2%(+4.01)#29 | 0.96%(+4.21)#1,554 |
| 30. | Pine Grove | 5.1% | 1.2%(+3.91)#30 | 0.96%(+4.10)#1,601 |
| 31. | Chapmanville | 4.9% | 1.2%(+3.78)#31 | 0.96%(+3.98)#1,658 |
| 32. | Romney | 4.9% | 1.2%(+3.74)#32 | 0.96%(+3.93)#1,680 |
| 33. | Ridgeley | 4.7% | 1.2%(+3.52)#33 | 0.96%(+3.72)#1,791 |
| 34. | Wiley Ford | 4.7% | 1.2%(+3.51)#34 | 0.96%(+3.71)#1,798 |
| 35. | Junior | 4.7% | 1.2%(+3.50)#35 | 0.96%(+3.69)#1,810 |
| 36. | Anmoore | 4.6% | 1.2%(+3.45)#36 | 0.96%(+3.65)#1,835 |
| 37. | Williamson | 4.6% | 1.2%(+3.45)#37 | 0.96%(+3.64)#1,842 |
| 38. | Prosperity | 4.4% | 1.2%(+3.28)#38 | 0.96%(+3.47)#1,945 |
| 39. | Huttonsville | 4.4% | 1.2%(+3.24)#39 | 0.96%(+3.43)#1,970 |
| 40. | Newell | 4.4% | 1.2%(+3.23)#40 | 0.96%(+3.42)#1,975 |
| 41. | Pinch | 4.4% | 1.2%(+3.20)#41 | 0.96%(+3.39)#1,994 |
| 42. | Dupont | 4.1% | 1.2%(+2.97)#42 | 0.96%(+3.16)#2,172 |
| 43. | White Hall | 4.1% | 1.2%(+2.92)#43 | 0.96%(+3.12)#2,220 |
| 44. | Windsor Heights | 3.9% | 1.2%(+2.77)#44 | 0.96%(+2.96)#2,336 |
| 45. | Marmet | 3.9% | 1.2%(+2.73)#45 | 0.96%(+2.92)#2,361 |
| 46. | Bridgeport | 3.8% | 1.2%(+2.66)#46 | 0.96%(+2.86)#2,425 |
| 47. | Parsons | 3.8% | 1.2%(+2.62)#47 | 0.96%(+2.81)#2,480 |
| 48. | Rivesville | 3.7% | 1.2%(+2.54)#48 | 0.96%(+2.73)#2,549 |
| 49. | Mitchell Heights | 3.7% | 1.2%(+2.51)#49 | 0.96%(+2.70)#2,571 |
| 50. | Northfork | 3.5% | 1.2%(+2.32)#50 | 0.96%(+2.52)#2,734 |
| 51. | Charles Town | 3.4% | 1.2%(+2.26)#51 | 0.96%(+2.45)#2,798 |
| 52. | Man | 3.4% | 1.2%(+2.20)#52 | 0.96%(+2.39)#2,857 |
| 53. | Shady Spring | 3.4% | 1.2%(+2.20)#53 | 0.96%(+2.39)#2,859 |
| 54. | Flatwoods | 3.3% | 1.2%(+2.18)#54 | 0.96%(+2.37)#2,881 |
| 55. | Terra Alta | 3.2% | 1.2%(+2.02)#55 | 0.96%(+2.21)#3,089 |
| 56. | Hundred | 3.1% | 1.2%(+1.95)#56 | 0.96%(+2.14)#3,164 |
| 57. | Sistersville | 3.1% | 1.2%(+1.91)#57 | 0.96%(+2.11)#3,214 |
| 58. | Glasgow | 3.1% | 1.2%(+1.91)#58 | 0.96%(+2.10)#3,221 |
| 59. | Reedy | 3.0% | 1.2%(+1.88)#59 | 0.96%(+2.07)#3,275 |
| 60. | Richwood | 3.0% | 1.2%(+1.80)#60 | 0.96%(+2.00)#3,382 |
| 61. | Albright | 3.0% | 1.2%(+1.80)#61 | 0.96%(+1.99)#3,388 |
| 62. | Mabscott | 2.9% | 1.2%(+1.79)#62 | 0.96%(+1.98)#3,403 |
| 63. | West Hamlin | 2.9% | 1.2%(+1.79)#63 | 0.96%(+1.98)#3,419 |
| 64. | Weston | 2.9% | 1.2%(+1.77)#64 | 0.96%(+1.96)#3,448 |
| 65. | Thomas | 2.8% | 1.2%(+1.68)#65 | 0.96%(+1.87)#3,585 |
| 66. | St Marys | 2.8% | 1.2%(+1.67)#66 | 0.96%(+1.86)#3,606 |
| 67. | Clarksburg | 2.8% | 1.2%(+1.60)#67 | 0.96%(+1.80)#3,707 |
| 68. | Ronceverte | 2.6% | 1.2%(+1.46)#68 | 0.96%(+1.65)#3,960 |
| 69. | Wellsburg | 2.6% | 1.2%(+1.45)#69 | 0.96%(+1.64)#3,978 |
| 70. | Burnsville | 2.6% | 1.2%(+1.41)#70 | 0.96%(+1.60)#4,050 |
| 71. | Elizabeth | 2.5% | 1.2%(+1.36)#71 | 0.96%(+1.56)#4,152 |
| 72. | Stonewood | 2.5% | 1.2%(+1.32)#72 | 0.96%(+1.52)#4,229 |
| 73. | Athens | 2.5% | 1.2%(+1.31)#73 | 0.96%(+1.51)#4,251 |
| 74. | Glen Dale | 2.4% | 1.2%(+1.26)#74 | 0.96%(+1.46)#4,348 |
| 75. | Gilbert | 2.3% | 1.2%(+1.17)#75 | 0.96%(+1.36)#4,552 |
| 76. | Teays Valley | 2.3% | 1.2%(+1.17)#76 | 0.96%(+1.36)#4,565 |
| 77. | New Cumberland | 2.3% | 1.2%(+1.13)#77 | 0.96%(+1.32)#4,647 |
| 78. | New Haven | 2.2% | 1.2%(+1.09)#78 | 0.96%(+1.28)#4,741 |
| 79. | Spencer | 2.2% | 1.2%(+1.07)#79 | 0.96%(+1.26)#4,775 |
| 80. | Lumberport | 2.1% | 1.2%(+0.973)#80 | 0.96%(+1.17)#4,995 |
| 81. | Leon | 2.1% | 1.2%(+0.973)#81 | 0.96%(+1.17)#4,998 |
| 82. | Hinton | 2.1% | 1.2%(+0.960)#82 | 0.96%(+1.15)#5,027 |
| 83. | Mullens | 2.1% | 1.2%(+0.959)#83 | 0.96%(+1.15)#5,029 |
| 84. | Alderson | 2.1% | 1.2%(+0.907)#84 | 0.96%(+1.10)#5,168 |
| 85. | Brookhaven | 2.0% | 1.2%(+0.895)#85 | 0.96%(+1.09)#5,205 |
| 86. | St Albans | 2.0% | 1.2%(+0.885)#86 | 0.96%(+1.08)#5,232 |
| 87. | New Martinsville | 2.0% | 1.2%(+0.863)#87 | 0.96%(+1.06)#5,285 |
| 88. | West Logan | 2.0% | 1.2%(+0.832)#88 | 0.96%(+1.02)#5,368 |
| 89. | Sissonville | 2.0% | 1.2%(+0.806)#89 | 0.96%(+0.998)#5,439 |
| 90. | Gauley Bridge | 1.9% | 1.2%(+0.793)#90 | 0.96%(+0.985)#5,477 |
| 91. | Oak Hill | 1.9% | 1.2%(+0.792)#91 | 0.96%(+0.984)#5,480 |
| 92. | East Bank | 1.9% | 1.2%(+0.758)#92 | 0.96%(+0.950)#5,584 |
| 93. | Lesage | 1.8% | 1.2%(+0.687)#93 | 0.96%(+0.879)#5,777 |
| 94. | Newburg | 1.8% | 1.2%(+0.599)#94 | 0.96%(+0.792)#6,082 |
| 95. | Blennerhassett | 1.7% | 1.2%(+0.545)#95 | 0.96%(+0.738)#6,267 |
| 96. | Gassaway | 1.7% | 1.2%(+0.495)#96 | 0.96%(+0.688)#6,439 |
| 97. | Madison | 1.6% | 1.2%(+0.491)#97 | 0.96%(+0.684)#6,456 |
| 98. | Chester | 1.6% | 1.2%(+0.460)#98 | 0.96%(+0.652)#6,573 |
| 99. | Barrackville | 1.6% | 1.2%(+0.418)#99 | 0.96%(+0.611)#6,723 |
| 100. | Davis | 1.6% | 1.2%(+0.416)#100 | 0.96%(+0.608)#6,741 |
Common Questions
What are the Top 10 Cities with the Highest Percentage of Population Employed in Law Enforcement in West Virginia?
Top 10 Cities with the Highest Percentage of Population Employed in Law Enforcement in West Virginia are:
#1
36.7%
#2
27.5%
#3
13.6%
#4
13.3%
#5
13.2%
#6
13.0%
#7
12.4%
#8
11.5%
#9
11.1%
#10
10.1%
What city has the Highest Percentage of Population Employed in Law Enforcement in West Virginia?
Omar has the Highest Percentage of Population Employed in Law Enforcement in West Virginia with 36.7%.
What is the Percentage of Population Employed in Law Enforcement in the State of West Virginia?
Percentage of Population Employed in Law Enforcement in West Virginia is 1.2%.
What is the Percentage of Population Employed in Law Enforcement in the United States?
Percentage of Population Employed in Law Enforcement in the United States is 0.96%.