Cities with the Highest Percentage of Population Employed in Law Enforcement in Utah
RELATED REPORTS & OPTIONS
Law Enforcement
Utah
Compare Cities
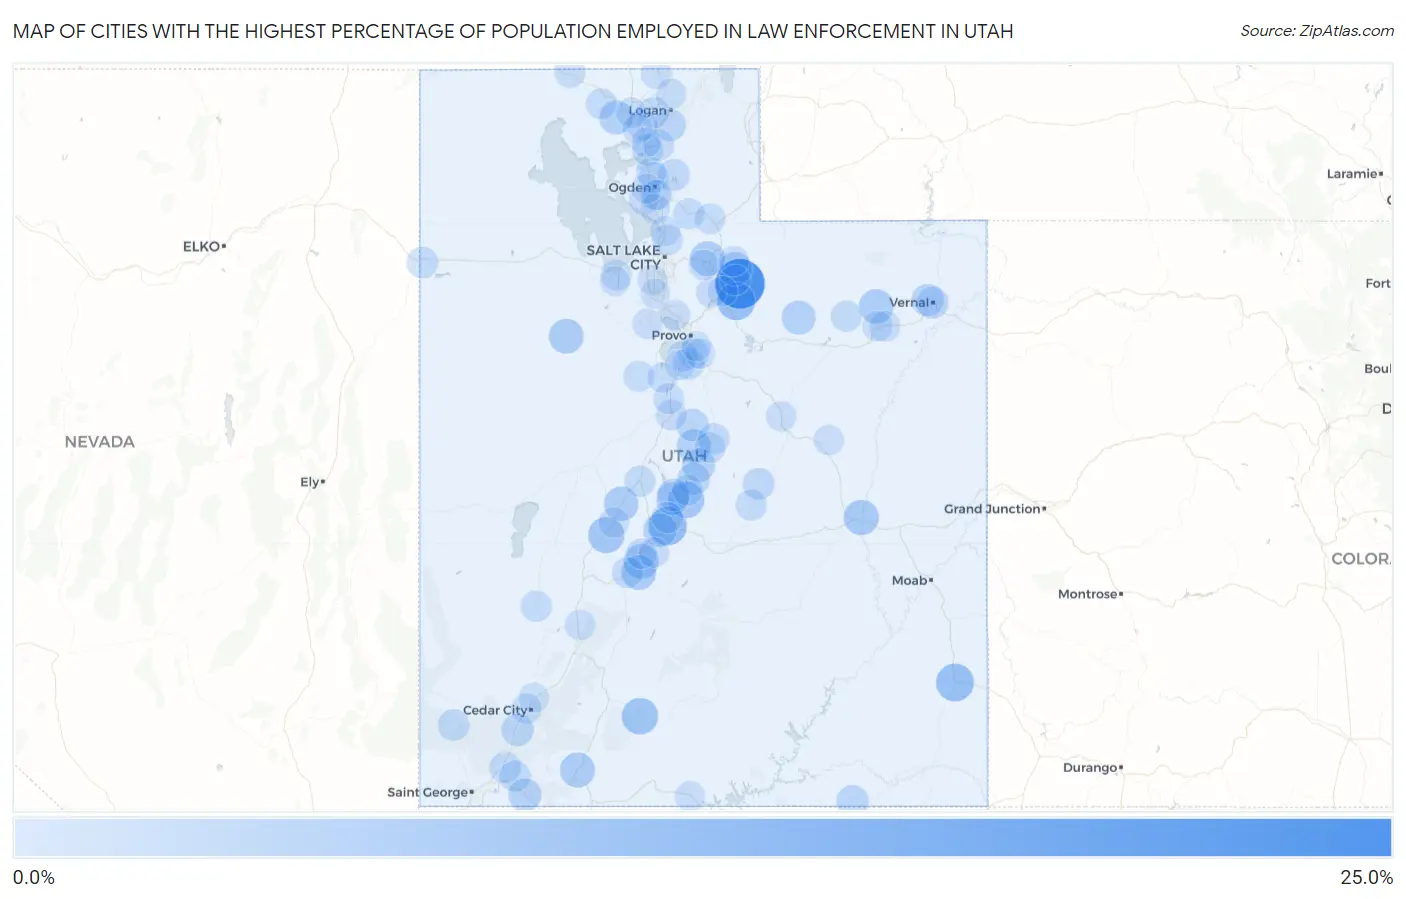
Map of Cities with the Highest Percentage of Population Employed in Law Enforcement in Utah
0.0%
25.0%
Cities with the Highest Percentage of Population Employed in Law Enforcement in Utah
| City | % Employed | vs State | vs National | |
| 1. | Woodland | 20.6% | 0.67%(+20.0)#1 | 0.96%(+19.7)#126 |
| 2. | Salina | 9.2% | 0.67%(+8.49)#2 | 0.96%(+8.20)#562 |
| 3. | Timber Lakes | 8.5% | 0.67%(+7.87)#3 | 0.96%(+7.58)#644 |
| 4. | Monticello | 8.5% | 0.67%(+7.86)#4 | 0.96%(+7.57)#647 |
| 5. | Tropic | 7.1% | 0.67%(+6.47)#5 | 0.96%(+6.18)#887 |
| 6. | Meadow | 6.9% | 0.67%(+6.19)#6 | 0.96%(+5.90)#967 |
| 7. | Mayfield | 6.9% | 0.67%(+6.19)#7 | 0.96%(+5.89)#969 |
| 8. | Green River | 5.9% | 0.67%(+5.18)#8 | 0.96%(+4.89)#1,271 |
| 9. | Orderville | 5.7% | 0.67%(+5.01)#9 | 0.96%(+4.72)#1,328 |
| 10. | Silver Summit | 5.6% | 0.67%(+4.98)#10 | 0.96%(+4.69)#1,347 |
| 11. | Central Valley | 5.6% | 0.67%(+4.90)#11 | 0.96%(+4.61)#1,376 |
| 12. | Monroe | 5.4% | 0.67%(+4.78)#12 | 0.96%(+4.49)#1,430 |
| 13. | Dugway | 5.4% | 0.67%(+4.73)#13 | 0.96%(+4.43)#1,454 |
| 14. | Neola | 5.2% | 0.67%(+4.50)#14 | 0.96%(+4.21)#1,551 |
| 15. | Holden | 5.2% | 0.67%(+4.49)#15 | 0.96%(+4.20)#1,557 |
| 16. | Wales | 4.7% | 0.67%(+4.02)#16 | 0.96%(+3.72)#1,783 |
| 17. | Tabiona | 4.7% | 0.67%(+4.02)#17 | 0.96%(+3.72)#1,784 |
| 18. | Marion | 4.6% | 0.67%(+3.91)#18 | 0.96%(+3.62)#1,850 |
| 19. | Thatcher | 4.5% | 0.67%(+3.80)#19 | 0.96%(+3.51)#1,918 |
| 20. | Aurora | 4.1% | 0.67%(+3.45)#20 | 0.96%(+3.15)#2,180 |
| 21. | Ephraim | 4.0% | 0.67%(+3.28)#21 | 0.96%(+2.99)#2,313 |
| 22. | Apple Valley | 3.7% | 0.67%(+3.07)#22 | 0.96%(+2.78)#2,507 |
| 23. | Centerfield | 3.5% | 0.67%(+2.80)#23 | 0.96%(+2.51)#2,742 |
| 24. | Manti | 3.2% | 0.67%(+2.55)#24 | 0.96%(+2.26)#3,017 |
| 25. | Fountain Green | 3.2% | 0.67%(+2.53)#25 | 0.96%(+2.23)#3,053 |
| 26. | Gunnison | 3.2% | 0.67%(+2.50)#26 | 0.96%(+2.20)#3,098 |
| 27. | Oljato Monument Valley | 3.1% | 0.67%(+2.48)#27 | 0.96%(+2.19)#3,117 |
| 28. | Kanarraville | 3.1% | 0.67%(+2.46)#28 | 0.96%(+2.16)#3,141 |
| 29. | Maeser | 3.0% | 0.67%(+2.31)#29 | 0.96%(+2.02)#3,353 |
| 30. | Vernal | 2.9% | 0.67%(+2.25)#30 | 0.96%(+1.96)#3,453 |
| 31. | Hyrum | 2.7% | 0.67%(+2.08)#31 | 0.96%(+1.79)#3,723 |
| 32. | Eden | 2.6% | 0.67%(+1.98)#32 | 0.96%(+1.69)#3,893 |
| 33. | Enterprise | 2.5% | 0.67%(+1.78)#33 | 0.96%(+1.49)#4,284 |
| 34. | Orangeville | 2.4% | 0.67%(+1.78)#34 | 0.96%(+1.48)#4,296 |
| 35. | Toquerville | 2.3% | 0.67%(+1.62)#35 | 0.96%(+1.32)#4,640 |
| 36. | Wendover | 2.3% | 0.67%(+1.62)#36 | 0.96%(+1.32)#4,646 |
| 37. | Salem | 2.3% | 0.67%(+1.59)#37 | 0.96%(+1.30)#4,702 |
| 38. | Virgin | 2.2% | 0.67%(+1.52)#38 | 0.96%(+1.23)#4,857 |
| 39. | Perry | 2.2% | 0.67%(+1.52)#39 | 0.96%(+1.22)#4,877 |
| 40. | Mount Pleasant | 2.1% | 0.67%(+1.44)#40 | 0.96%(+1.15)#5,031 |
| 41. | Redmond | 2.0% | 0.67%(+1.37)#41 | 0.96%(+1.08)#5,222 |
| 42. | Milford | 2.0% | 0.67%(+1.35)#42 | 0.96%(+1.06)#5,286 |
| 43. | Scipio | 2.0% | 0.67%(+1.32)#43 | 0.96%(+1.03)#5,357 |
| 44. | Altamont | 1.9% | 0.67%(+1.24)#44 | 0.96%(+0.948)#5,589 |
| 45. | Joseph | 1.9% | 0.67%(+1.20)#45 | 0.96%(+0.910)#5,691 |
| 46. | Ferron | 1.9% | 0.67%(+1.19)#46 | 0.96%(+0.897)#5,733 |
| 47. | Mantua | 1.9% | 0.67%(+1.19)#47 | 0.96%(+0.893)#5,740 |
| 48. | Mendon | 1.8% | 0.67%(+1.17)#48 | 0.96%(+0.880)#5,775 |
| 49. | Howell | 1.8% | 0.67%(+1.13)#49 | 0.96%(+0.834)#5,916 |
| 50. | Morgan | 1.8% | 0.67%(+1.10)#50 | 0.96%(+0.810)#6,002 |
| 51. | Cornish | 1.7% | 0.67%(+1.07)#51 | 0.96%(+0.776)#6,137 |
| 52. | Honeyville | 1.7% | 0.67%(+1.06)#52 | 0.96%(+0.764)#6,176 |
| 53. | Stansbury Park | 1.7% | 0.67%(+1.03)#53 | 0.96%(+0.740)#6,256 |
| 54. | Snowville | 1.7% | 0.67%(+1.03)#54 | 0.96%(+0.732)#6,290 |
| 55. | Nephi | 1.7% | 0.67%(+1.02)#55 | 0.96%(+0.726)#6,309 |
| 56. | Ballard | 1.7% | 0.67%(+1.02)#56 | 0.96%(+0.725)#6,313 |
| 57. | Eureka | 1.7% | 0.67%(+1.01)#57 | 0.96%(+0.721)#6,332 |
| 58. | Henefer | 1.6% | 0.67%(+0.919)#58 | 0.96%(+0.625)#6,688 |
| 59. | Sterling | 1.6% | 0.67%(+0.919)#59 | 0.96%(+0.625)#6,692 |
| 60. | Bountiful | 1.5% | 0.67%(+0.818)#60 | 0.96%(+0.524)#7,066 |
| 61. | Mona | 1.5% | 0.67%(+0.815)#61 | 0.96%(+0.521)#7,082 |
| 62. | Spring City | 1.5% | 0.67%(+0.791)#62 | 0.96%(+0.497)#7,174 |
| 63. | Richfield | 1.4% | 0.67%(+0.755)#63 | 0.96%(+0.462)#7,351 |
| 64. | Spanish Fork | 1.4% | 0.67%(+0.734)#64 | 0.96%(+0.440)#7,453 |
| 65. | Benjamin | 1.4% | 0.67%(+0.724)#65 | 0.96%(+0.430)#7,498 |
| 66. | Harrisville | 1.4% | 0.67%(+0.709)#66 | 0.96%(+0.416)#7,557 |
| 67. | Washington Terrace | 1.4% | 0.67%(+0.701)#67 | 0.96%(+0.407)#7,601 |
| 68. | Eagle Mountain | 1.4% | 0.67%(+0.684)#68 | 0.96%(+0.390)#7,672 |
| 69. | Cedar City | 1.3% | 0.67%(+0.665)#69 | 0.96%(+0.371)#7,766 |
| 70. | Helper | 1.3% | 0.67%(+0.639)#70 | 0.96%(+0.345)#7,894 |
| 71. | Beaver | 1.3% | 0.67%(+0.631)#71 | 0.96%(+0.337)#7,924 |
| 72. | East Carbon | 1.3% | 0.67%(+0.619)#72 | 0.96%(+0.325)#7,977 |
| 73. | Midway | 1.3% | 0.67%(+0.596)#73 | 0.96%(+0.302)#8,087 |
| 74. | Francis | 1.3% | 0.67%(+0.596)#74 | 0.96%(+0.302)#8,090 |
| 75. | Fillmore | 1.2% | 0.67%(+0.539)#75 | 0.96%(+0.245)#8,355 |
| 76. | Big Water | 1.2% | 0.67%(+0.536)#76 | 0.96%(+0.242)#8,375 |
| 77. | Smithfield | 1.2% | 0.67%(+0.497)#77 | 0.96%(+0.203)#8,574 |
| 78. | Roosevelt | 1.2% | 0.67%(+0.494)#78 | 0.96%(+0.201)#8,589 |
| 79. | Snyderville | 1.2% | 0.67%(+0.493)#79 | 0.96%(+0.199)#8,605 |
| 80. | American Fork | 1.2% | 0.67%(+0.485)#80 | 0.96%(+0.192)#8,644 |
| 81. | Glenwood | 1.1% | 0.67%(+0.481)#81 | 0.96%(+0.187)#8,671 |
| 82. | Heber | 1.1% | 0.67%(+0.441)#82 | 0.96%(+0.147)#8,892 |
| 83. | Goshen | 1.1% | 0.67%(+0.435)#83 | 0.96%(+0.141)#8,929 |
| 84. | Tremonton | 1.1% | 0.67%(+0.427)#84 | 0.96%(+0.133)#8,972 |
| 85. | Pleasant View | 1.1% | 0.67%(+0.412)#85 | 0.96%(+0.118)#9,062 |
| 86. | Bear River City | 1.1% | 0.67%(+0.409)#86 | 0.96%(+0.116)#9,080 |
| 87. | Oakley | 1.0% | 0.67%(+0.368)#87 | 0.96%(+0.074)#9,311 |
| 88. | Brigham City | 1.0% | 0.67%(+0.364)#88 | 0.96%(+0.070)#9,336 |
| 89. | Payson | 1.0% | 0.67%(+0.359)#89 | 0.96%(+0.065)#9,353 |
| 90. | South Ogden | 1.0% | 0.67%(+0.354)#90 | 0.96%(+0.060)#9,382 |
| 91. | Clinton | 1.0% | 0.67%(+0.336)#91 | 0.96%(+0.042)#9,485 |
| 92. | Layton | 0.99% | 0.67%(+0.322)#92 | 0.96%(+0.028)#9,572 |
| 93. | West Jordan | 0.97% | 0.67%(+0.299)#93 | 0.96%(+0.006)#9,696 |
| 94. | Enoch | 0.96% | 0.67%(+0.288)#94 | 0.96%(-0.006)#9,771 |
| 95. | Centerville | 0.95% | 0.67%(+0.285)#95 | 0.96%(-0.009)#9,786 |
| 96. | Mapleton | 0.94% | 0.67%(+0.272)#96 | 0.96%(-0.022)#9,852 |
| 97. | Springville | 0.94% | 0.67%(+0.269)#97 | 0.96%(-0.025)#9,864 |
| 98. | West Haven | 0.93% | 0.67%(+0.264)#98 | 0.96%(-0.030)#9,895 |
| 99. | Riverton | 0.93% | 0.67%(+0.260)#99 | 0.96%(-0.034)#9,920 |
| 100. | Erda | 0.93% | 0.67%(+0.258)#100 | 0.96%(-0.036)#9,933 |
Common Questions
What are the Top 10 Cities with the Highest Percentage of Population Employed in Law Enforcement in Utah?
Top 10 Cities with the Highest Percentage of Population Employed in Law Enforcement in Utah are:
#1
20.6%
#2
9.2%
#3
8.5%
#4
8.5%
#5
7.1%
#6
6.9%
#7
6.9%
#8
5.9%
#9
5.7%
#10
5.6%
What city has the Highest Percentage of Population Employed in Law Enforcement in Utah?
Woodland has the Highest Percentage of Population Employed in Law Enforcement in Utah with 20.6%.
What is the Percentage of Population Employed in Law Enforcement in the State of Utah?
Percentage of Population Employed in Law Enforcement in Utah is 0.67%.
What is the Percentage of Population Employed in Law Enforcement in the United States?
Percentage of Population Employed in Law Enforcement in the United States is 0.96%.