Cities with the Highest Percentage of Population Employed in Law Enforcement in Maryland
RELATED REPORTS & OPTIONS
Law Enforcement
Maryland
Compare Cities
Map of Cities with the Highest Percentage of Population Employed in Law Enforcement in Maryland
0.0%
50.0%
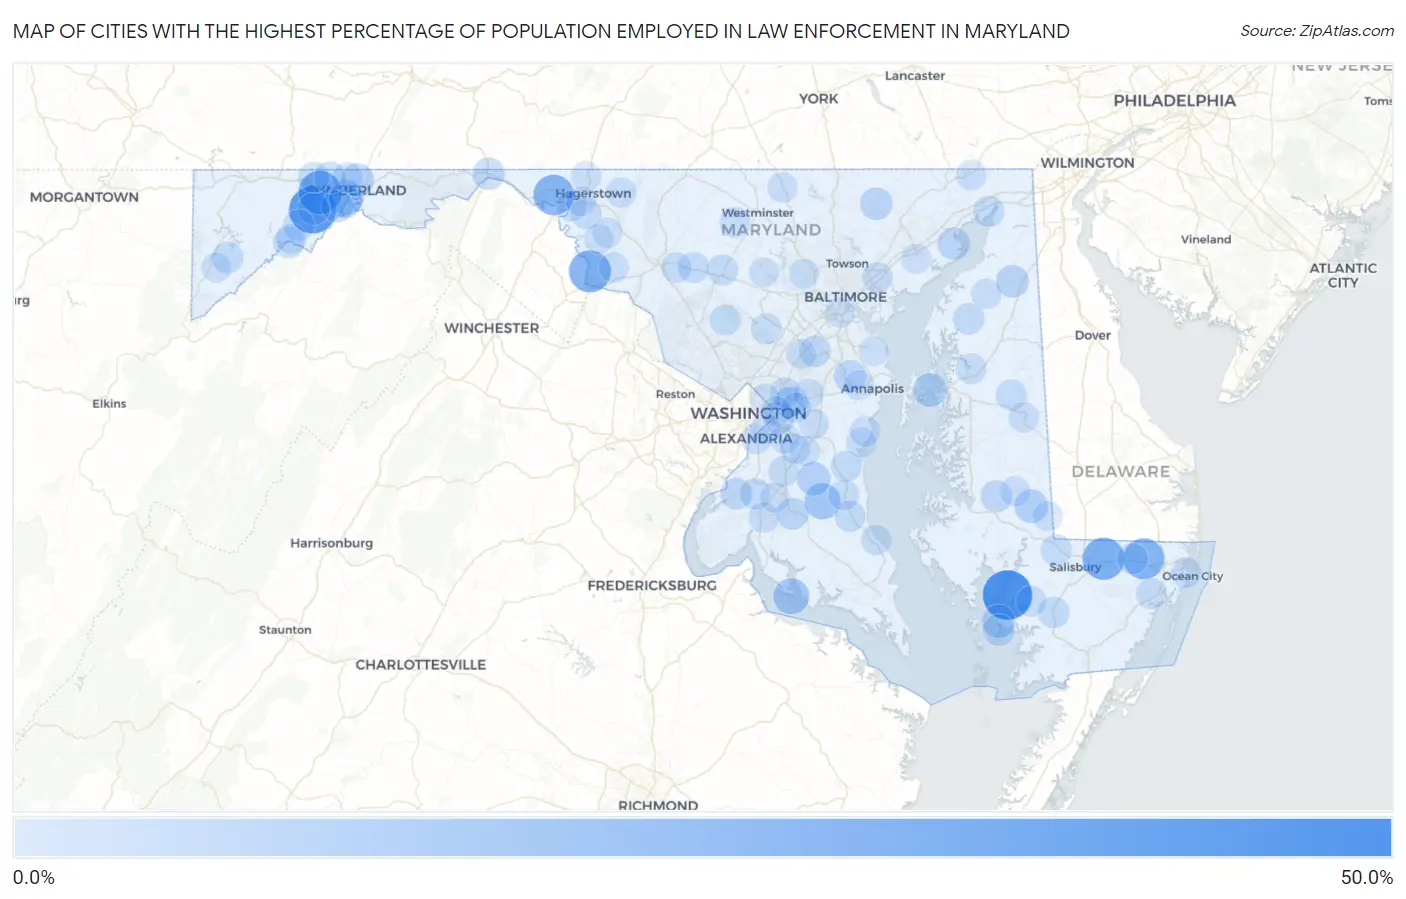
Cities with the Highest Percentage of Population Employed in Law Enforcement in Maryland
| City | % Employed | vs State | vs National | |
| 1. | Nanticoke | 43.6% | 1.2%(+42.4)#1 | 0.96%(+42.7)#19 |
| 2. | Gilmore | 38.2% | 1.2%(+37.0)#2 | 0.96%(+37.3)#31 |
| 3. | Grahamtown | 29.8% | 1.2%(+28.5)#3 | 0.96%(+28.8)#57 |
| 4. | Parsonsburg | 27.5% | 1.2%(+26.3)#4 | 0.96%(+26.5)#71 |
| 5. | Dargan | 27.3% | 1.2%(+26.1)#5 | 0.96%(+26.3)#72 |
| 6. | Whaleyville | 25.0% | 1.2%(+23.8)#6 | 0.96%(+24.0)#92 |
| 7. | Charlton | 24.4% | 1.2%(+23.2)#7 | 0.96%(+23.5)#100 |
| 8. | Aquasco | 14.8% | 1.2%(+13.6)#8 | 0.96%(+13.9)#213 |
| 9. | Cobb Island | 14.1% | 1.2%(+12.9)#9 | 0.96%(+13.2)#235 |
| 10. | Bowling Green | 11.4% | 1.2%(+10.2)#10 | 0.96%(+10.4)#366 |
| 11. | Ten Mile Creek | 11.3% | 1.2%(+10.1)#11 | 0.96%(+10.4)#370 |
| 12. | Kent Narrows | 9.8% | 1.2%(+8.55)#12 | 0.96%(+8.79)#488 |
| 13. | Brookview | 9.5% | 1.2%(+8.32)#13 | 0.96%(+8.56)#518 |
| 14. | Baden | 9.4% | 1.2%(+8.23)#14 | 0.96%(+8.48)#530 |
| 15. | Potomac Park | 9.1% | 1.2%(+7.90)#15 | 0.96%(+8.15)#566 |
| 16. | Chance | 9.1% | 1.2%(+7.88)#16 | 0.96%(+8.13)#570 |
| 17. | Bowmans Addition | 8.4% | 1.2%(+7.21)#17 | 0.96%(+7.46)#665 |
| 18. | Galena | 7.4% | 1.2%(+6.23)#18 | 0.96%(+6.48)#835 |
| 19. | Aberdeen Proving Ground | 7.3% | 1.2%(+6.08)#19 | 0.96%(+6.33)#862 |
| 20. | Jarrettsville | 7.0% | 1.2%(+5.82)#20 | 0.96%(+6.06)#930 |
| 21. | Abingdon | 6.9% | 1.2%(+5.68)#21 | 0.96%(+5.93)#964 |
| 22. | Capitol Heights | 6.8% | 1.2%(+5.63)#22 | 0.96%(+5.87)#976 |
| 23. | Crownsville | 6.8% | 1.2%(+5.57)#23 | 0.96%(+5.81)#988 |
| 24. | Hancock | 6.6% | 1.2%(+5.43)#24 | 0.96%(+5.67)#1,037 |
| 25. | Cresaptown | 6.4% | 1.2%(+5.16)#25 | 0.96%(+5.41)#1,109 |
| 26. | Bryantown | 6.3% | 1.2%(+5.13)#26 | 0.96%(+5.38)#1,117 |
| 27. | Midland | 6.2% | 1.2%(+5.00)#27 | 0.96%(+5.24)#1,156 |
| 28. | Deal Island | 6.0% | 1.2%(+4.74)#28 | 0.96%(+4.99)#1,232 |
| 29. | Mount Savage | 5.9% | 1.2%(+4.70)#29 | 0.96%(+4.94)#1,254 |
| 30. | Bryans Road | 5.6% | 1.2%(+4.43)#30 | 0.96%(+4.68)#1,348 |
| 31. | Secretary | 5.6% | 1.2%(+4.35)#31 | 0.96%(+4.59)#1,381 |
| 32. | Fort Meade | 5.4% | 1.2%(+4.20)#32 | 0.96%(+4.45)#1,446 |
| 33. | Deer Park | 5.3% | 1.2%(+4.13)#33 | 0.96%(+4.37)#1,485 |
| 34. | Chestertown | 5.3% | 1.2%(+4.11)#34 | 0.96%(+4.35)#1,489 |
| 35. | Princess Anne | 5.0% | 1.2%(+3.74)#35 | 0.96%(+3.99)#1,654 |
| 36. | Luke | 4.8% | 1.2%(+3.55)#36 | 0.96%(+3.80)#1,752 |
| 37. | Hebron | 4.7% | 1.2%(+3.45)#37 | 0.96%(+3.69)#1,807 |
| 38. | Charlestown | 4.6% | 1.2%(+3.36)#38 | 0.96%(+3.60)#1,854 |
| 39. | Barton | 4.5% | 1.2%(+3.29)#39 | 0.96%(+3.53)#1,898 |
| 40. | Ridgely | 4.4% | 1.2%(+3.23)#40 | 0.96%(+3.47)#1,944 |
| 41. | Laytonsville | 4.4% | 1.2%(+3.20)#41 | 0.96%(+3.45)#1,959 |
| 42. | Bensville | 4.3% | 1.2%(+3.11)#42 | 0.96%(+3.35)#2,027 |
| 43. | Mount Airy | 4.3% | 1.2%(+3.07)#43 | 0.96%(+3.31)#2,060 |
| 44. | New Market | 4.3% | 1.2%(+3.05)#44 | 0.96%(+3.30)#2,064 |
| 45. | Finzel | 4.2% | 1.2%(+3.03)#45 | 0.96%(+3.28)#2,083 |
| 46. | Owings | 4.2% | 1.2%(+3.01)#46 | 0.96%(+3.26)#2,097 |
| 47. | Prince Frederick | 4.0% | 1.2%(+2.79)#47 | 0.96%(+3.04)#2,263 |
| 48. | Willards | 4.0% | 1.2%(+2.79)#48 | 0.96%(+3.03)#2,280 |
| 49. | Springdale | 3.9% | 1.2%(+2.67)#49 | 0.96%(+2.92)#2,371 |
| 50. | Newark | 3.8% | 1.2%(+2.57)#50 | 0.96%(+2.81)#2,475 |
| 51. | New Windsor | 3.8% | 1.2%(+2.55)#51 | 0.96%(+2.79)#2,491 |
| 52. | Mount Vernon | 3.7% | 1.2%(+2.52)#52 | 0.96%(+2.76)#2,519 |
| 53. | Highland | 3.7% | 1.2%(+2.49)#53 | 0.96%(+2.73)#2,545 |
| 54. | Brandywine | 3.7% | 1.2%(+2.47)#54 | 0.96%(+2.71)#2,559 |
| 55. | St James | 3.6% | 1.2%(+2.43)#55 | 0.96%(+2.67)#2,595 |
| 56. | Huntingtown | 3.6% | 1.2%(+2.41)#56 | 0.96%(+2.65)#2,612 |
| 57. | Rossville | 3.6% | 1.2%(+2.40)#57 | 0.96%(+2.64)#2,620 |
| 58. | Centreville | 3.4% | 1.2%(+2.24)#58 | 0.96%(+2.48)#2,770 |
| 59. | Bartonsville | 3.4% | 1.2%(+2.16)#59 | 0.96%(+2.40)#2,844 |
| 60. | Hillcrest Heights | 3.3% | 1.2%(+2.14)#60 | 0.96%(+2.39)#2,860 |
| 61. | Long Beach | 3.3% | 1.2%(+2.09)#61 | 0.96%(+2.34)#2,925 |
| 62. | Rising Sun | 3.3% | 1.2%(+2.05)#62 | 0.96%(+2.29)#2,969 |
| 63. | Mount Rainier | 3.2% | 1.2%(+1.97)#63 | 0.96%(+2.21)#3,079 |
| 64. | Williamsport | 3.2% | 1.2%(+1.96)#64 | 0.96%(+2.20)#3,100 |
| 65. | Manchester | 3.1% | 1.2%(+1.92)#65 | 0.96%(+2.17)#3,131 |
| 66. | Kennedyville | 3.1% | 1.2%(+1.87)#66 | 0.96%(+2.11)#3,200 |
| 67. | Brock Hall | 3.0% | 1.2%(+1.80)#67 | 0.96%(+2.04)#3,313 |
| 68. | Glenarden | 3.0% | 1.2%(+1.77)#68 | 0.96%(+2.02)#3,346 |
| 69. | Forest Heights | 3.0% | 1.2%(+1.76)#69 | 0.96%(+2.00)#3,373 |
| 70. | Shady Side | 3.0% | 1.2%(+1.75)#70 | 0.96%(+1.99)#3,387 |
| 71. | New Carrollton | 2.9% | 1.2%(+1.74)#71 | 0.96%(+1.98)#3,407 |
| 72. | West Ocean City | 2.9% | 1.2%(+1.73)#72 | 0.96%(+1.98)#3,428 |
| 73. | Denton | 2.9% | 1.2%(+1.70)#73 | 0.96%(+1.94)#3,473 |
| 74. | Westernport | 2.9% | 1.2%(+1.65)#74 | 0.96%(+1.89)#3,552 |
| 75. | Burkittsville | 2.8% | 1.2%(+1.61)#75 | 0.96%(+1.85)#3,620 |
| 76. | Hurlock | 2.8% | 1.2%(+1.57)#76 | 0.96%(+1.82)#3,670 |
| 77. | La Plata | 2.7% | 1.2%(+1.51)#77 | 0.96%(+1.75)#3,785 |
| 78. | Fairwood | 2.7% | 1.2%(+1.47)#78 | 0.96%(+1.72)#3,826 |
| 79. | Rosaryville | 2.7% | 1.2%(+1.46)#79 | 0.96%(+1.70)#3,855 |
| 80. | Cavetown | 2.7% | 1.2%(+1.46)#80 | 0.96%(+1.70)#3,860 |
| 81. | Corriganville | 2.7% | 1.2%(+1.44)#81 | 0.96%(+1.69)#3,889 |
| 82. | Randallstown | 2.6% | 1.2%(+1.43)#82 | 0.96%(+1.68)#3,907 |
| 83. | Fairmount Heights | 2.6% | 1.2%(+1.40)#83 | 0.96%(+1.64)#3,972 |
| 84. | Baltimore Highlands | 2.6% | 1.2%(+1.37)#84 | 0.96%(+1.61)#4,020 |
| 85. | Maugansville | 2.5% | 1.2%(+1.32)#85 | 0.96%(+1.56)#4,140 |
| 86. | Deale | 2.5% | 1.2%(+1.29)#86 | 0.96%(+1.53)#4,201 |
| 87. | Parole | 2.5% | 1.2%(+1.26)#87 | 0.96%(+1.51)#4,247 |
| 88. | Maryland City | 2.5% | 1.2%(+1.26)#88 | 0.96%(+1.50)#4,264 |
| 89. | Loch Lynn Heights | 2.5% | 1.2%(+1.25)#89 | 0.96%(+1.50)#4,271 |
| 90. | Marlton | 2.4% | 1.2%(+1.24)#90 | 0.96%(+1.48)#4,305 |
| 91. | Sharptown | 2.4% | 1.2%(+1.19)#91 | 0.96%(+1.44)#4,400 |
| 92. | Andrews Afb | 2.4% | 1.2%(+1.18)#92 | 0.96%(+1.42)#4,420 |
| 93. | Sykesville | 2.3% | 1.2%(+1.13)#93 | 0.96%(+1.38)#4,520 |
| 94. | Halfway | 2.3% | 1.2%(+1.12)#94 | 0.96%(+1.36)#4,541 |
| 95. | Boonsboro | 2.3% | 1.2%(+1.10)#95 | 0.96%(+1.35)#4,586 |
| 96. | Lake Arbor | 2.3% | 1.2%(+1.09)#96 | 0.96%(+1.33)#4,620 |
| 97. | Lake Shore | 2.3% | 1.2%(+1.08)#97 | 0.96%(+1.33)#4,629 |
| 98. | Waldorf | 2.3% | 1.2%(+1.07)#98 | 0.96%(+1.31)#4,666 |
| 99. | Keedysville | 2.3% | 1.2%(+1.04)#99 | 0.96%(+1.29)#4,720 |
| 100. | Edgewood | 2.2% | 1.2%(+1.03)#100 | 0.96%(+1.28)#4,744 |
Common Questions
What are the Top 10 Cities with the Highest Percentage of Population Employed in Law Enforcement in Maryland?
Top 10 Cities with the Highest Percentage of Population Employed in Law Enforcement in Maryland are:
#1
43.6%
#2
38.2%
#3
29.8%
#4
27.5%
#5
27.3%
#6
25.0%
#7
24.4%
#8
14.8%
#9
14.1%
#10
11.4%
What city has the Highest Percentage of Population Employed in Law Enforcement in Maryland?
Nanticoke has the Highest Percentage of Population Employed in Law Enforcement in Maryland with 43.6%.
What is the Percentage of Population Employed in Law Enforcement in the State of Maryland?
Percentage of Population Employed in Law Enforcement in Maryland is 1.2%.
What is the Percentage of Population Employed in Law Enforcement in the United States?
Percentage of Population Employed in Law Enforcement in the United States is 0.96%.