Cities with the Highest Percentage of Population Employed in Law Enforcement in New Hampshire
RELATED REPORTS & OPTIONS
Law Enforcement
New Hampshire
Compare Cities
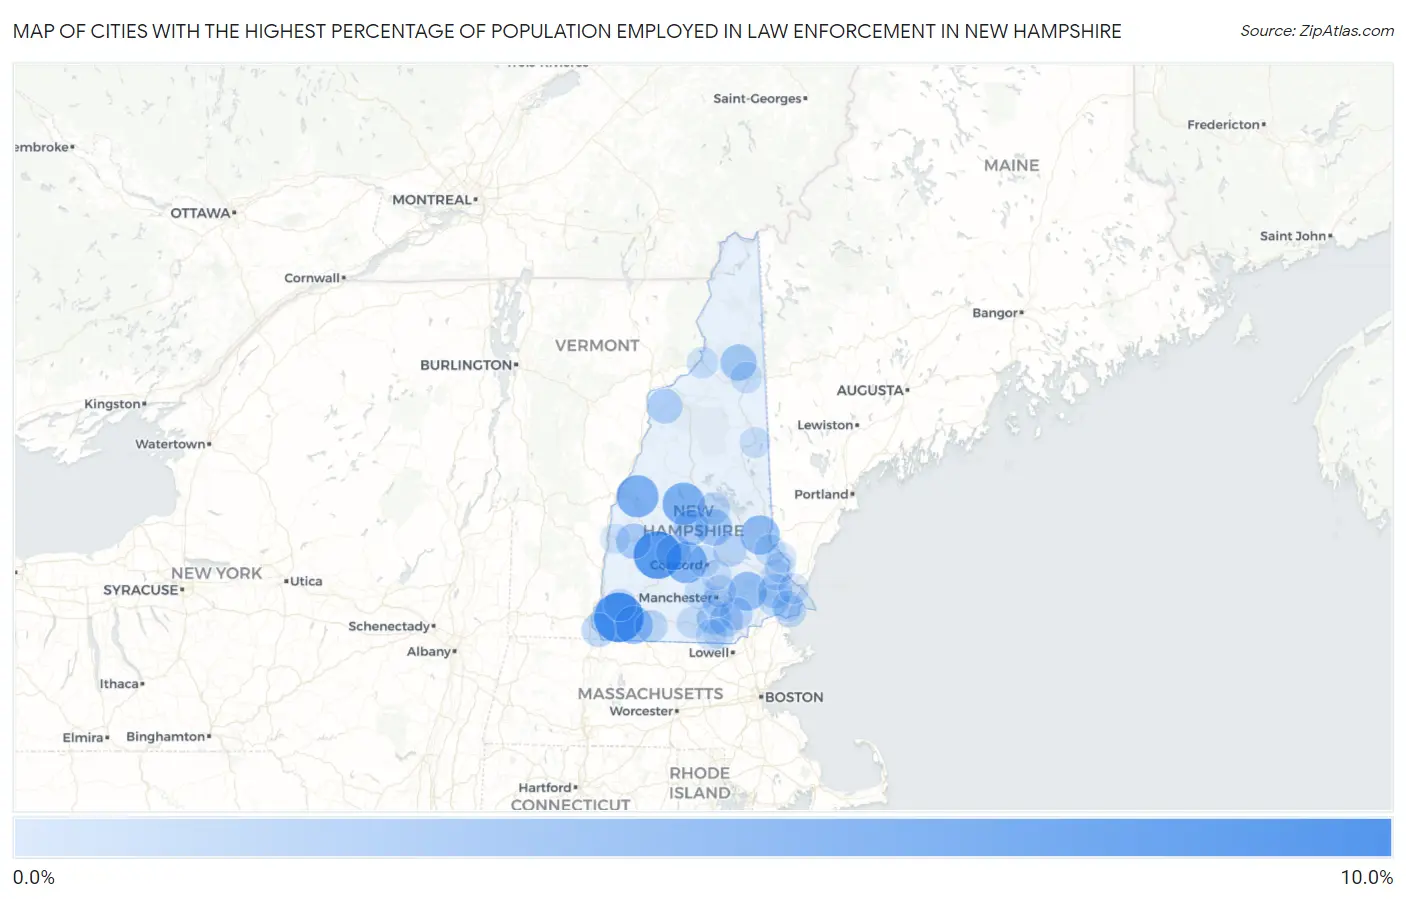
Map of Cities with the Highest Percentage of Population Employed in Law Enforcement in New Hampshire
0.0%
10.0%
Cities with the Highest Percentage of Population Employed in Law Enforcement in New Hampshire
| City | % Employed | vs State | vs National | |
| 1. | West Swanzey | 8.5% | 0.73%(+7.78)#1 | 0.96%(+7.55)#649 |
| 2. | Bradford | 7.7% | 0.73%(+6.93)#2 | 0.96%(+6.70)#788 |
| 3. | Bristol | 5.3% | 0.73%(+4.53)#3 | 0.96%(+4.30)#1,512 |
| 4. | Enfield | 5.1% | 0.73%(+4.38)#4 | 0.96%(+4.16)#1,575 |
| 5. | Contoocook | 4.9% | 0.73%(+4.15)#5 | 0.96%(+3.92)#1,686 |
| 6. | Farmington | 3.9% | 0.73%(+3.21)#6 | 0.96%(+2.98)#2,324 |
| 7. | Raymond | 3.7% | 0.73%(+2.92)#7 | 0.96%(+2.69)#2,581 |
| 8. | Troy | 3.4% | 0.73%(+2.71)#8 | 0.96%(+2.48)#2,773 |
| 9. | Belmont | 2.7% | 0.73%(+2.01)#9 | 0.96%(+1.78)#3,726 |
| 10. | Berlin | 2.6% | 0.73%(+1.89)#10 | 0.96%(+1.66)#3,942 |
| 11. | Warner | 2.4% | 0.73%(+1.62)#11 | 0.96%(+1.39)#4,491 |
| 12. | Newport | 2.3% | 0.73%(+1.59)#12 | 0.96%(+1.36)#4,557 |
| 13. | Franklin | 2.3% | 0.73%(+1.59)#13 | 0.96%(+1.36)#4,558 |
| 14. | Lisbon | 2.0% | 0.73%(+1.22)#14 | 0.96%(+0.989)#5,467 |
| 15. | Newfields | 1.8% | 0.73%(+1.02)#15 | 0.96%(+0.792)#6,081 |
| 16. | Hinsdale | 1.7% | 0.73%(+0.933)#16 | 0.96%(+0.704)#6,389 |
| 17. | East Merrimack | 1.6% | 0.73%(+0.869)#17 | 0.96%(+0.640)#6,632 |
| 18. | Londonderry | 1.5% | 0.73%(+0.754)#18 | 0.96%(+0.525)#7,061 |
| 19. | Pittsfield | 1.4% | 0.73%(+0.664)#19 | 0.96%(+0.435)#7,471 |
| 20. | Derry | 1.3% | 0.73%(+0.572)#20 | 0.96%(+0.343)#7,901 |
| 21. | Laconia | 1.0% | 0.73%(+0.310)#21 | 0.96%(+0.081)#9,271 |
| 22. | Jaffrey | 1.0% | 0.73%(+0.304)#22 | 0.96%(+0.075)#9,306 |
| 23. | Keene | 1.00% | 0.73%(+0.264)#23 | 0.96%(+0.035)#9,530 |
| 24. | South Hooksett | 0.90% | 0.73%(+0.171)#24 | 0.96%(-0.058)#10,052 |
| 25. | Hampton Beach | 0.80% | 0.73%(+0.069)#25 | 0.96%(-0.159)#10,689 |
| 26. | Concord | 0.72% | 0.73%(-0.018)#26 | 0.96%(-0.246)#11,307 |
| 27. | Milford | 0.69% | 0.73%(-0.039)#27 | 0.96%(-0.268)#11,488 |
| 28. | Exeter | 0.60% | 0.73%(-0.134)#28 | 0.96%(-0.363)#12,213 |
| 29. | Gorham | 0.57% | 0.73%(-0.168)#29 | 0.96%(-0.397)#12,486 |
| 30. | Goffstown | 0.56% | 0.73%(-0.170)#30 | 0.96%(-0.399)#12,497 |
| 31. | Nashua | 0.56% | 0.73%(-0.174)#31 | 0.96%(-0.403)#12,529 |
| 32. | Rochester | 0.55% | 0.73%(-0.182)#32 | 0.96%(-0.411)#12,592 |
| 33. | Lancaster | 0.54% | 0.73%(-0.191)#33 | 0.96%(-0.420)#12,664 |
| 34. | Hampton | 0.53% | 0.73%(-0.202)#34 | 0.96%(-0.430)#12,728 |
| 35. | Manchester | 0.34% | 0.73%(-0.389)#35 | 0.96%(-0.618)#14,147 |
| 36. | Conway | 0.34% | 0.73%(-0.395)#36 | 0.96%(-0.624)#14,193 |
| 37. | Hudson | 0.33% | 0.73%(-0.407)#37 | 0.96%(-0.636)#14,268 |
| 38. | Durham | 0.32% | 0.73%(-0.411)#38 | 0.96%(-0.640)#14,297 |
| 39. | Suncook | 0.29% | 0.73%(-0.439)#39 | 0.96%(-0.668)#14,473 |
| 40. | Portsmouth | 0.27% | 0.73%(-0.468)#40 | 0.96%(-0.697)#14,643 |
| 41. | Dover | 0.23% | 0.73%(-0.506)#41 | 0.96%(-0.735)#14,831 |
| 42. | Somersworth | 0.14% | 0.73%(-0.591)#42 | 0.96%(-0.820)#15,174 |
| 43. | Claremont | 0.10% | 0.73%(-0.631)#43 | 0.96%(-0.859)#15,270 |
1
Common Questions
What are the Top 10 Cities with the Highest Percentage of Population Employed in Law Enforcement in New Hampshire?
Top 10 Cities with the Highest Percentage of Population Employed in Law Enforcement in New Hampshire are:
#1
8.5%
#2
7.7%
#3
5.3%
#4
5.1%
#5
4.9%
#6
3.9%
#7
3.7%
#8
3.4%
#9
2.7%
#10
2.6%
What city has the Highest Percentage of Population Employed in Law Enforcement in New Hampshire?
West Swanzey has the Highest Percentage of Population Employed in Law Enforcement in New Hampshire with 8.5%.
What is the Percentage of Population Employed in Law Enforcement in the State of New Hampshire?
Percentage of Population Employed in Law Enforcement in New Hampshire is 0.73%.
What is the Percentage of Population Employed in Law Enforcement in the United States?
Percentage of Population Employed in Law Enforcement in the United States is 0.96%.