Cities with the Highest Percentage of Population Employed in Law Enforcement in Massachusetts
RELATED REPORTS & OPTIONS
Law Enforcement
Massachusetts
Compare Cities
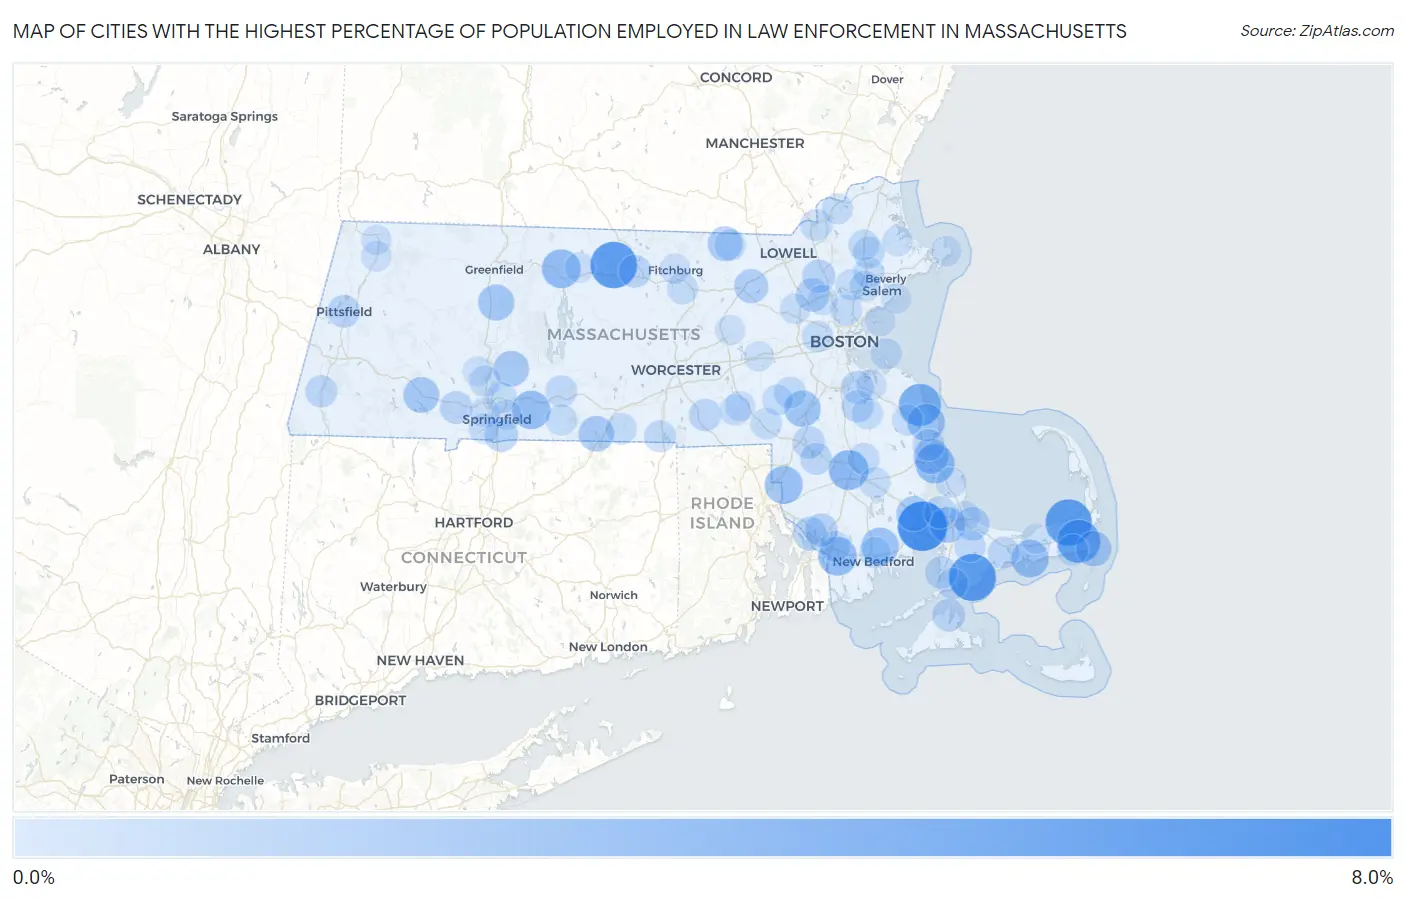
Map of Cities with the Highest Percentage of Population Employed in Law Enforcement in Massachusetts
0.0%
8.0%
Cities with the Highest Percentage of Population Employed in Law Enforcement in Massachusetts
| City | % Employed | vs State | vs National | |
| 1. | Wareham Center | 7.7% | 0.88%(+6.81)#1 | 0.96%(+6.73)#781 |
| 2. | Seabrook | 6.8% | 0.88%(+5.95)#2 | 0.96%(+5.87)#977 |
| 3. | Baldwinville | 6.6% | 0.88%(+5.77)#3 | 0.96%(+5.69)#1,031 |
| 4. | Brewster | 6.5% | 0.88%(+5.66)#4 | 0.96%(+5.57)#1,063 |
| 5. | East Harwich | 5.4% | 0.88%(+4.49)#5 | 0.96%(+4.40)#1,467 |
| 6. | Marshfield Hills | 5.1% | 0.88%(+4.19)#6 | 0.96%(+4.11)#1,599 |
| 7. | Raynham Center | 4.2% | 0.88%(+3.29)#7 | 0.96%(+3.21)#2,127 |
| 8. | Plymouth | 4.0% | 0.88%(+3.13)#8 | 0.96%(+3.04)#2,260 |
| 9. | Orange | 3.8% | 0.88%(+2.95)#9 | 0.96%(+2.87)#2,415 |
| 10. | North Westport | 3.8% | 0.88%(+2.89)#10 | 0.96%(+2.80)#2,484 |
| 11. | Wilbraham | 3.7% | 0.88%(+2.87)#11 | 0.96%(+2.78)#2,506 |
| 12. | North Seekonk | 3.5% | 0.88%(+2.64)#12 | 0.96%(+2.56)#2,693 |
| 13. | West Yarmouth | 3.4% | 0.88%(+2.54)#13 | 0.96%(+2.45)#2,795 |
| 14. | Acushnet Center | 3.3% | 0.88%(+2.44)#14 | 0.96%(+2.36)#2,899 |
| 15. | Marshfield | 3.3% | 0.88%(+2.42)#15 | 0.96%(+2.33)#2,929 |
| 16. | Cedar Crest | 3.3% | 0.88%(+2.38)#16 | 0.96%(+2.29)#2,968 |
| 17. | Walpole | 3.0% | 0.88%(+2.14)#17 | 0.96%(+2.05)#3,299 |
| 18. | South Deerfield | 2.9% | 0.88%(+2.01)#18 | 0.96%(+1.92)#3,508 |
| 19. | Blandford | 2.8% | 0.88%(+1.93)#19 | 0.96%(+1.85)#3,637 |
| 20. | Granby | 2.7% | 0.88%(+1.85)#20 | 0.96%(+1.77)#3,758 |
| 21. | North Plymouth | 2.7% | 0.88%(+1.83)#21 | 0.96%(+1.75)#3,788 |
| 22. | Holland | 2.7% | 0.88%(+1.82)#22 | 0.96%(+1.74)#3,807 |
| 23. | Buzzards Bay | 2.7% | 0.88%(+1.81)#23 | 0.96%(+1.73)#3,814 |
| 24. | Chatham | 2.7% | 0.88%(+1.80)#24 | 0.96%(+1.71)#3,834 |
| 25. | West Wareham | 2.6% | 0.88%(+1.67)#25 | 0.96%(+1.59)#4,079 |
| 26. | Pepperell | 2.4% | 0.88%(+1.57)#26 | 0.96%(+1.48)#4,302 |
| 27. | Littleton Common | 2.2% | 0.88%(+1.33)#27 | 0.96%(+1.24)#4,827 |
| 28. | Ocean Grove | 2.1% | 0.88%(+1.19)#28 | 0.96%(+1.10)#5,158 |
| 29. | Sandwich | 2.1% | 0.88%(+1.18)#29 | 0.96%(+1.09)#5,185 |
| 30. | Burlington | 2.0% | 0.88%(+1.11)#30 | 0.96%(+1.02)#5,366 |
| 31. | Longmeadow | 2.0% | 0.88%(+1.11)#31 | 0.96%(+1.02)#5,372 |
| 32. | Wilmington | 1.9% | 0.88%(+1.02)#32 | 0.96%(+0.934)#5,618 |
| 33. | Somerset | 1.9% | 0.88%(+0.980)#33 | 0.96%(+0.895)#5,736 |
| 34. | Vineyard Haven | 1.8% | 0.88%(+0.909)#34 | 0.96%(+0.824)#5,940 |
| 35. | Braintree Town | 1.8% | 0.88%(+0.907)#35 | 0.96%(+0.822)#5,956 |
| 36. | Westfield | 1.7% | 0.88%(+0.854)#36 | 0.96%(+0.769)#6,158 |
| 37. | Gardner | 1.7% | 0.88%(+0.848)#37 | 0.96%(+0.764)#6,178 |
| 38. | Pittsfield | 1.7% | 0.88%(+0.838)#38 | 0.96%(+0.753)#6,211 |
| 39. | Mansfield Center | 1.7% | 0.88%(+0.823)#39 | 0.96%(+0.738)#6,260 |
| 40. | West Falmouth | 1.6% | 0.88%(+0.749)#40 | 0.96%(+0.664)#6,518 |
| 41. | Whitinsville | 1.6% | 0.88%(+0.737)#41 | 0.96%(+0.652)#6,571 |
| 42. | White Island Shores | 1.6% | 0.88%(+0.731)#42 | 0.96%(+0.646)#6,606 |
| 43. | Holbrook | 1.6% | 0.88%(+0.703)#43 | 0.96%(+0.618)#6,704 |
| 44. | Great Barrington | 1.6% | 0.88%(+0.686)#44 | 0.96%(+0.601)#6,769 |
| 45. | Norton Center | 1.5% | 0.88%(+0.631)#45 | 0.96%(+0.546)#6,976 |
| 46. | Barnstable Town | 1.5% | 0.88%(+0.606)#46 | 0.96%(+0.521)#7,080 |
| 47. | Webster | 1.5% | 0.88%(+0.592)#47 | 0.96%(+0.507)#7,135 |
| 48. | Methuen Town | 1.5% | 0.88%(+0.591)#48 | 0.96%(+0.506)#7,137 |
| 49. | South Duxbury | 1.5% | 0.88%(+0.585)#49 | 0.96%(+0.501)#7,161 |
| 50. | Palmer Town | 1.4% | 0.88%(+0.557)#50 | 0.96%(+0.472)#7,301 |
| 51. | Topsfield | 1.4% | 0.88%(+0.536)#51 | 0.96%(+0.451)#7,399 |
| 52. | Forestdale | 1.4% | 0.88%(+0.493)#52 | 0.96%(+0.408)#7,590 |
| 53. | Medfield | 1.3% | 0.88%(+0.467)#53 | 0.96%(+0.382)#7,716 |
| 54. | Harwich Port | 1.3% | 0.88%(+0.461)#54 | 0.96%(+0.376)#7,746 |
| 55. | Bridgewater Town | 1.3% | 0.88%(+0.456)#55 | 0.96%(+0.371)#7,768 |
| 56. | Holyoke | 1.3% | 0.88%(+0.440)#56 | 0.96%(+0.355)#7,840 |
| 57. | East Pepperell | 1.3% | 0.88%(+0.423)#57 | 0.96%(+0.338)#7,916 |
| 58. | Leominster | 1.3% | 0.88%(+0.422)#58 | 0.96%(+0.338)#7,921 |
| 59. | Melrose | 1.3% | 0.88%(+0.415)#59 | 0.96%(+0.330)#7,959 |
| 60. | Franklin Town | 1.3% | 0.88%(+0.412)#60 | 0.96%(+0.327)#7,970 |
| 61. | Southbridge Town | 1.3% | 0.88%(+0.403)#61 | 0.96%(+0.318)#8,011 |
| 62. | Lynnfield | 1.3% | 0.88%(+0.393)#62 | 0.96%(+0.308)#8,059 |
| 63. | Teaticket | 1.3% | 0.88%(+0.377)#63 | 0.96%(+0.293)#8,122 |
| 64. | New Bedford | 1.3% | 0.88%(+0.376)#64 | 0.96%(+0.291)#8,128 |
| 65. | Hull | 1.2% | 0.88%(+0.366)#65 | 0.96%(+0.282)#8,186 |
| 66. | Monson Center | 1.2% | 0.88%(+0.353)#66 | 0.96%(+0.269)#8,252 |
| 67. | Danvers | 1.2% | 0.88%(+0.347)#67 | 0.96%(+0.263)#8,274 |
| 68. | Haverhill | 1.2% | 0.88%(+0.344)#68 | 0.96%(+0.260)#8,289 |
| 69. | Watertown Town | 1.2% | 0.88%(+0.340)#69 | 0.96%(+0.255)#8,312 |
| 70. | Boxford | 1.2% | 0.88%(+0.321)#70 | 0.96%(+0.236)#8,403 |
| 71. | Middleborough Center | 1.2% | 0.88%(+0.320)#71 | 0.96%(+0.235)#8,410 |
| 72. | Hopedale | 1.2% | 0.88%(+0.305)#72 | 0.96%(+0.220)#8,485 |
| 73. | Fall River | 1.2% | 0.88%(+0.297)#73 | 0.96%(+0.212)#8,521 |
| 74. | Chicopee | 1.2% | 0.88%(+0.286)#74 | 0.96%(+0.202)#8,582 |
| 75. | Abington | 1.2% | 0.88%(+0.281)#75 | 0.96%(+0.196)#8,623 |
| 76. | North Pembroke | 1.2% | 0.88%(+0.279)#76 | 0.96%(+0.194)#8,633 |
| 77. | Peabody | 1.1% | 0.88%(+0.264)#77 | 0.96%(+0.179)#8,718 |
| 78. | Millis Clicquot | 1.1% | 0.88%(+0.258)#78 | 0.96%(+0.174)#8,750 |
| 79. | Hanscom Afb | 1.1% | 0.88%(+0.175)#79 | 0.96%(+0.090)#9,231 |
| 80. | Springfield | 1.0% | 0.88%(+0.166)#80 | 0.96%(+0.081)#9,272 |
| 81. | Amherst | 1.0% | 0.88%(+0.156)#81 | 0.96%(+0.071)#9,330 |
| 82. | Agawam Town | 1.0% | 0.88%(+0.155)#82 | 0.96%(+0.070)#9,335 |
| 83. | The Pinehills | 1.0% | 0.88%(+0.145)#83 | 0.96%(+0.061)#9,378 |
| 84. | Milford | 1.0% | 0.88%(+0.135)#84 | 0.96%(+0.050)#9,445 |
| 85. | Woburn | 1.0% | 0.88%(+0.132)#85 | 0.96%(+0.047)#9,459 |
| 86. | Weymouth Town | 1.00% | 0.88%(+0.121)#86 | 0.96%(+0.037)#9,521 |
| 87. | Adams | 1.00% | 0.88%(+0.118)#87 | 0.96%(+0.033)#9,546 |
| 88. | Athol | 0.99% | 0.88%(+0.109)#88 | 0.96%(+0.024)#9,592 |
| 89. | North Adams | 0.98% | 0.88%(+0.104)#89 | 0.96%(+0.019)#9,621 |
| 90. | Rockport | 0.97% | 0.88%(+0.096)#90 | 0.96%(+0.011)#9,666 |
| 91. | Sagamore | 0.97% | 0.88%(+0.092)#91 | 0.96%(+0.007)#9,684 |
| 92. | Ipswich | 0.96% | 0.88%(+0.079)#92 | 0.96%(-0.006)#9,764 |
| 93. | West Springfield Town | 0.93% | 0.88%(+0.056)#93 | 0.96%(-0.029)#9,887 |
| 94. | Fitchburg | 0.91% | 0.88%(+0.033)#94 | 0.96%(-0.052)#10,015 |
| 95. | Yarmouth Port | 0.90% | 0.88%(+0.021)#95 | 0.96%(-0.064)#10,095 |
| 96. | Hudson | 0.89% | 0.88%(+0.013)#96 | 0.96%(-0.071)#10,128 |
| 97. | Easthampton Town | 0.89% | 0.88%(+0.012)#97 | 0.96%(-0.073)#10,132 |
| 98. | Framingham | 0.88% | 0.88%(+0.006)#98 | 0.96%(-0.079)#10,182 |
| 99. | Marblehead | 0.87% | 0.88%(-0.006)#99 | 0.96%(-0.091)#10,267 |
| 100. | Nahant | 0.85% | 0.88%(-0.030)#100 | 0.96%(-0.115)#10,405 |
Common Questions
What are the Top 10 Cities with the Highest Percentage of Population Employed in Law Enforcement in Massachusetts?
Top 10 Cities with the Highest Percentage of Population Employed in Law Enforcement in Massachusetts are:
#1
7.7%
#2
6.8%
#3
6.6%
#4
6.5%
#5
5.4%
#6
5.1%
#7
4.2%
#8
4.0%
#9
3.8%
#10
3.8%
What city has the Highest Percentage of Population Employed in Law Enforcement in Massachusetts?
Wareham Center has the Highest Percentage of Population Employed in Law Enforcement in Massachusetts with 7.7%.
What is the Percentage of Population Employed in Law Enforcement in the State of Massachusetts?
Percentage of Population Employed in Law Enforcement in Massachusetts is 0.88%.
What is the Percentage of Population Employed in Law Enforcement in the United States?
Percentage of Population Employed in Law Enforcement in the United States is 0.96%.