Cities with the Highest Percentage of Population Employed in Law Enforcement in Connecticut
RELATED REPORTS & OPTIONS
Law Enforcement
Connecticut
Compare Cities
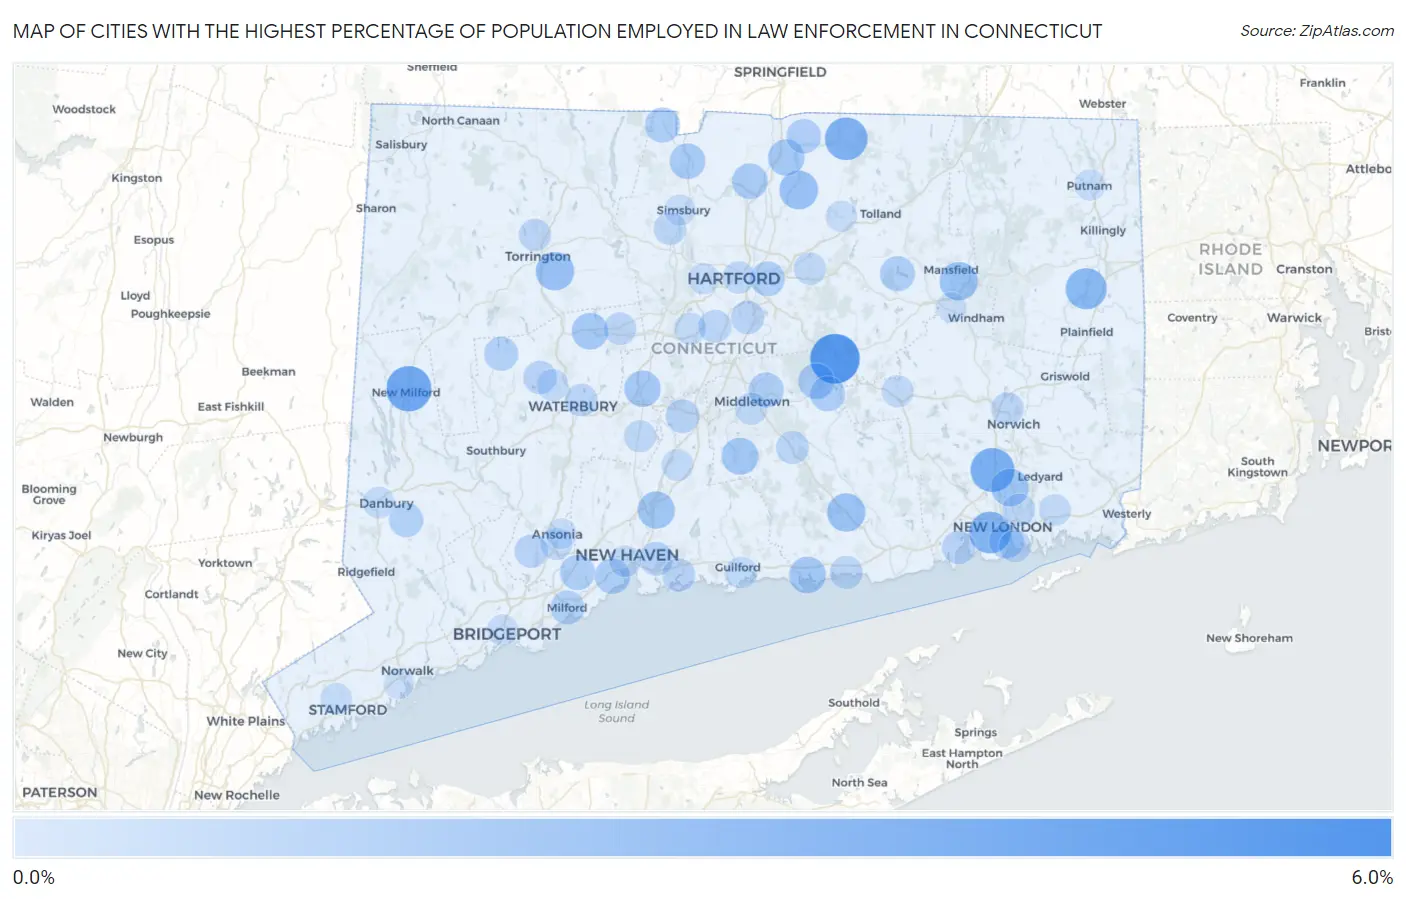
Map of Cities with the Highest Percentage of Population Employed in Law Enforcement in Connecticut
0.0%
6.0%
Cities with the Highest Percentage of Population Employed in Law Enforcement in Connecticut
| City | % Employed | vs State | vs National | |
| 1. | Riverton | 5.9% | 0.75%(+5.17)#1 | 0.96%(+4.96)#1,250 |
| 2. | Lake Bungee | 5.8% | 0.75%(+5.01)#2 | 0.96%(+4.80)#1,303 |
| 3. | Terramuggus | 5.5% | 0.75%(+4.71)#3 | 0.96%(+4.50)#1,420 |
| 4. | Gaylordsville | 5.4% | 0.75%(+4.62)#4 | 0.96%(+4.41)#1,464 |
| 5. | New Milford | 4.2% | 0.75%(+3.49)#5 | 0.96%(+3.28)#2,077 |
| 6. | Trumbull Center | 4.1% | 0.75%(+3.39)#6 | 0.96%(+3.18)#2,159 |
| 7. | Oxoboxo River | 3.8% | 0.75%(+3.07)#7 | 0.96%(+2.86)#2,424 |
| 8. | Somers | 3.5% | 0.75%(+2.73)#8 | 0.96%(+2.52)#2,732 |
| 9. | Waterford | 3.3% | 0.75%(+2.50)#9 | 0.96%(+2.29)#2,976 |
| 10. | Wauregan | 3.0% | 0.75%(+2.28)#10 | 0.96%(+2.07)#3,267 |
| 11. | Stepney | 2.7% | 0.75%(+1.91)#11 | 0.96%(+1.70)#3,869 |
| 12. | Broad Brook | 2.3% | 0.75%(+1.60)#12 | 0.96%(+1.39)#4,503 |
| 13. | Northwest Harwinton | 2.3% | 0.75%(+1.52)#13 | 0.96%(+1.31)#4,678 |
| 14. | Deep River Center | 2.3% | 0.75%(+1.51)#14 | 0.96%(+1.30)#4,687 |
| 15. | East | 2.3% | 0.75%(+1.50)#15 | 0.96%(+1.29)#4,717 |
| 16. | Mansfield Center | 2.3% | 0.75%(+1.50)#16 | 0.96%(+1.29)#4,719 |
| 17. | Jewett City Borough | 2.1% | 0.75%(+1.35)#17 | 0.96%(+1.14)#5,055 |
| 18. | Gales Ferry | 2.1% | 0.75%(+1.30)#18 | 0.96%(+1.09)#5,199 |
| 19. | North Haven | 2.0% | 0.75%(+1.21)#19 | 0.96%(+1.00)#5,429 |
| 20. | Durham | 1.8% | 0.75%(+1.08)#20 | 0.96%(+0.867)#5,810 |
| 21. | Clinton | 1.8% | 0.75%(+1.04)#21 | 0.96%(+0.830)#5,923 |
| 22. | Terryville | 1.8% | 0.75%(+1.01)#22 | 0.96%(+0.804)#6,025 |
| 23. | Plantsville | 1.7% | 0.75%(+0.976)#23 | 0.96%(+0.766)#6,172 |
| 24. | Southwood Acres | 1.7% | 0.75%(+0.954)#24 | 0.96%(+0.744)#6,245 |
| 25. | Quinnipiac University | 1.6% | 0.75%(+0.844)#25 | 0.96%(+0.634)#6,657 |
| 26. | Lake Pocotopaug | 1.6% | 0.75%(+0.836)#26 | 0.96%(+0.626)#6,683 |
| 27. | Salmon Brook | 1.5% | 0.75%(+0.756)#27 | 0.96%(+0.546)#6,980 |
| 28. | Windsor Locks | 1.5% | 0.75%(+0.753)#28 | 0.96%(+0.543)#6,991 |
| 29. | Newtown Borough | 1.5% | 0.75%(+0.751)#29 | 0.96%(+0.541)#6,998 |
| 30. | West Haven | 1.4% | 0.75%(+0.685)#30 | 0.96%(+0.475)#7,288 |
| 31. | Poplar Plains | 1.4% | 0.75%(+0.676)#31 | 0.96%(+0.466)#7,329 |
| 32. | Coventry Lake | 1.4% | 0.75%(+0.624)#32 | 0.96%(+0.414)#7,563 |
| 33. | East Hampton | 1.4% | 0.75%(+0.617)#33 | 0.96%(+0.407)#7,591 |
| 34. | Portland | 1.4% | 0.75%(+0.607)#34 | 0.96%(+0.397)#7,640 |
| 35. | Orange | 1.4% | 0.75%(+0.599)#35 | 0.96%(+0.389)#7,675 |
| 36. | North Granby | 1.3% | 0.75%(+0.590)#36 | 0.96%(+0.380)#7,727 |
| 37. | East Hartford | 1.3% | 0.75%(+0.498)#37 | 0.96%(+0.288)#8,143 |
| 38. | New London | 1.2% | 0.75%(+0.493)#38 | 0.96%(+0.283)#8,173 |
| 39. | Litchfield Borough | 1.2% | 0.75%(+0.463)#39 | 0.96%(+0.253)#8,320 |
| 40. | Hazardville | 1.2% | 0.75%(+0.458)#40 | 0.96%(+0.248)#8,344 |
| 41. | Bethel | 1.1% | 0.75%(+0.373)#41 | 0.96%(+0.163)#8,811 |
| 42. | Ball Pond | 1.1% | 0.75%(+0.372)#42 | 0.96%(+0.162)#8,816 |
| 43. | Bethlehem Village | 1.1% | 0.75%(+0.345)#43 | 0.96%(+0.135)#8,961 |
| 44. | Fairfield University | 1.1% | 0.75%(+0.340)#44 | 0.96%(+0.130)#8,993 |
| 45. | Milford City Balance | 1.1% | 0.75%(+0.306)#45 | 0.96%(+0.096)#9,197 |
| 46. | Sandy Hook | 0.98% | 0.75%(+0.224)#46 | 0.96%(+0.014)#9,649 |
| 47. | East Haven | 0.96% | 0.75%(+0.207)#47 | 0.96%(-0.003)#9,751 |
| 48. | Meriden | 0.95% | 0.75%(+0.197)#48 | 0.96%(-0.013)#9,802 |
| 49. | Watertown | 0.89% | 0.75%(+0.137)#49 | 0.96%(-0.073)#10,133 |
| 50. | Wethersfield | 0.88% | 0.75%(+0.131)#50 | 0.96%(-0.079)#10,187 |
| 51. | Niantic | 0.87% | 0.75%(+0.114)#51 | 0.96%(-0.096)#10,299 |
| 52. | Shelton | 0.83% | 0.75%(+0.077)#52 | 0.96%(-0.133)#10,535 |
| 53. | Branford Center | 0.81% | 0.75%(+0.061)#53 | 0.96%(-0.149)#10,621 |
| 54. | Westbrook Center | 0.77% | 0.75%(+0.015)#54 | 0.96%(-0.195)#10,918 |
| 55. | Higganum | 0.75% | 0.75%(-0.002)#55 | 0.96%(-0.212)#11,018 |
| 56. | Daniels Farm | 0.75% | 0.75%(-0.006)#56 | 0.96%(-0.216)#11,057 |
| 57. | Newington | 0.74% | 0.75%(-0.011)#57 | 0.96%(-0.221)#11,096 |
| 58. | Norwich | 0.70% | 0.75%(-0.053)#58 | 0.96%(-0.263)#11,445 |
| 59. | Conning Towers Nautilus Park | 0.69% | 0.75%(-0.061)#59 | 0.96%(-0.271)#11,511 |
| 60. | Weatogue | 0.68% | 0.75%(-0.075)#60 | 0.96%(-0.285)#11,613 |
| 61. | Waterbury | 0.66% | 0.75%(-0.092)#61 | 0.96%(-0.302)#11,742 |
| 62. | Bristol | 0.63% | 0.75%(-0.120)#62 | 0.96%(-0.330)#11,948 |
| 63. | Torrington | 0.63% | 0.75%(-0.125)#63 | 0.96%(-0.335)#11,993 |
| 64. | Hartford | 0.60% | 0.75%(-0.150)#64 | 0.96%(-0.360)#12,191 |
| 65. | Middletown | 0.60% | 0.75%(-0.158)#65 | 0.96%(-0.368)#12,256 |
| 66. | Manchester | 0.56% | 0.75%(-0.197)#66 | 0.96%(-0.407)#12,553 |
| 67. | Derby | 0.55% | 0.75%(-0.203)#67 | 0.96%(-0.413)#12,606 |
| 68. | Cheshire Village | 0.55% | 0.75%(-0.207)#68 | 0.96%(-0.417)#12,642 |
| 69. | Colchester | 0.53% | 0.75%(-0.225)#69 | 0.96%(-0.435)#12,767 |
| 70. | Groton | 0.51% | 0.75%(-0.238)#70 | 0.96%(-0.448)#12,849 |
| 71. | New Britain | 0.50% | 0.75%(-0.254)#71 | 0.96%(-0.464)#12,986 |
| 72. | Wallingford Center | 0.49% | 0.75%(-0.261)#72 | 0.96%(-0.471)#13,054 |
| 73. | Naugatuck Borough | 0.48% | 0.75%(-0.270)#73 | 0.96%(-0.480)#13,116 |
| 74. | Oakville | 0.48% | 0.75%(-0.277)#74 | 0.96%(-0.487)#13,163 |
| 75. | Old Mystic | 0.43% | 0.75%(-0.322)#75 | 0.96%(-0.532)#13,520 |
| 76. | Guilford Center | 0.43% | 0.75%(-0.324)#76 | 0.96%(-0.534)#13,532 |
| 77. | Woodmont Borough | 0.42% | 0.75%(-0.335)#77 | 0.96%(-0.545)#13,625 |
| 78. | New Haven | 0.42% | 0.75%(-0.336)#78 | 0.96%(-0.546)#13,639 |
| 79. | Danbury | 0.41% | 0.75%(-0.338)#79 | 0.96%(-0.548)#13,649 |
| 80. | Stamford | 0.41% | 0.75%(-0.341)#80 | 0.96%(-0.551)#13,683 |
| 81. | Northford | 0.40% | 0.75%(-0.349)#81 | 0.96%(-0.559)#13,734 |
| 82. | West Hartford | 0.30% | 0.75%(-0.449)#82 | 0.96%(-0.659)#14,415 |
| 83. | Rockville | 0.29% | 0.75%(-0.461)#83 | 0.96%(-0.671)#14,501 |
| 84. | Putnam | 0.27% | 0.75%(-0.479)#84 | 0.96%(-0.689)#14,598 |
| 85. | Bridgeport | 0.26% | 0.75%(-0.496)#85 | 0.96%(-0.706)#14,695 |
| 86. | Simsbury Center | 0.25% | 0.75%(-0.503)#86 | 0.96%(-0.713)#14,730 |
| 87. | Ansonia | 0.14% | 0.75%(-0.616)#87 | 0.96%(-0.826)#15,195 |
| 88. | Norwalk | 0.088% | 0.75%(-0.665)#88 | 0.96%(-0.875)#15,294 |
| 89. | Willimantic | 0.073% | 0.75%(-0.679)#89 | 0.96%(-0.889)#15,321 |
Common Questions
What are the Top 10 Cities with the Highest Percentage of Population Employed in Law Enforcement in Connecticut?
Top 10 Cities with the Highest Percentage of Population Employed in Law Enforcement in Connecticut are:
#1
5.5%
#2
4.2%
#3
3.8%
#4
3.5%
#5
3.3%
#6
3.0%
#7
2.3%
#8
2.3%
#9
2.3%
#10
2.3%
What city has the Highest Percentage of Population Employed in Law Enforcement in Connecticut?
Terramuggus has the Highest Percentage of Population Employed in Law Enforcement in Connecticut with 5.5%.
What is the Percentage of Population Employed in Law Enforcement in the State of Connecticut?
Percentage of Population Employed in Law Enforcement in Connecticut is 0.75%.
What is the Percentage of Population Employed in Law Enforcement in the United States?
Percentage of Population Employed in Law Enforcement in the United States is 0.96%.