Cities with the Highest Percentage of Population Employed in Law Enforcement in New Mexico
RELATED REPORTS & OPTIONS
Law Enforcement
New Mexico
Compare Cities
Map of Cities with the Highest Percentage of Population Employed in Law Enforcement in New Mexico
0.0%
80.0%
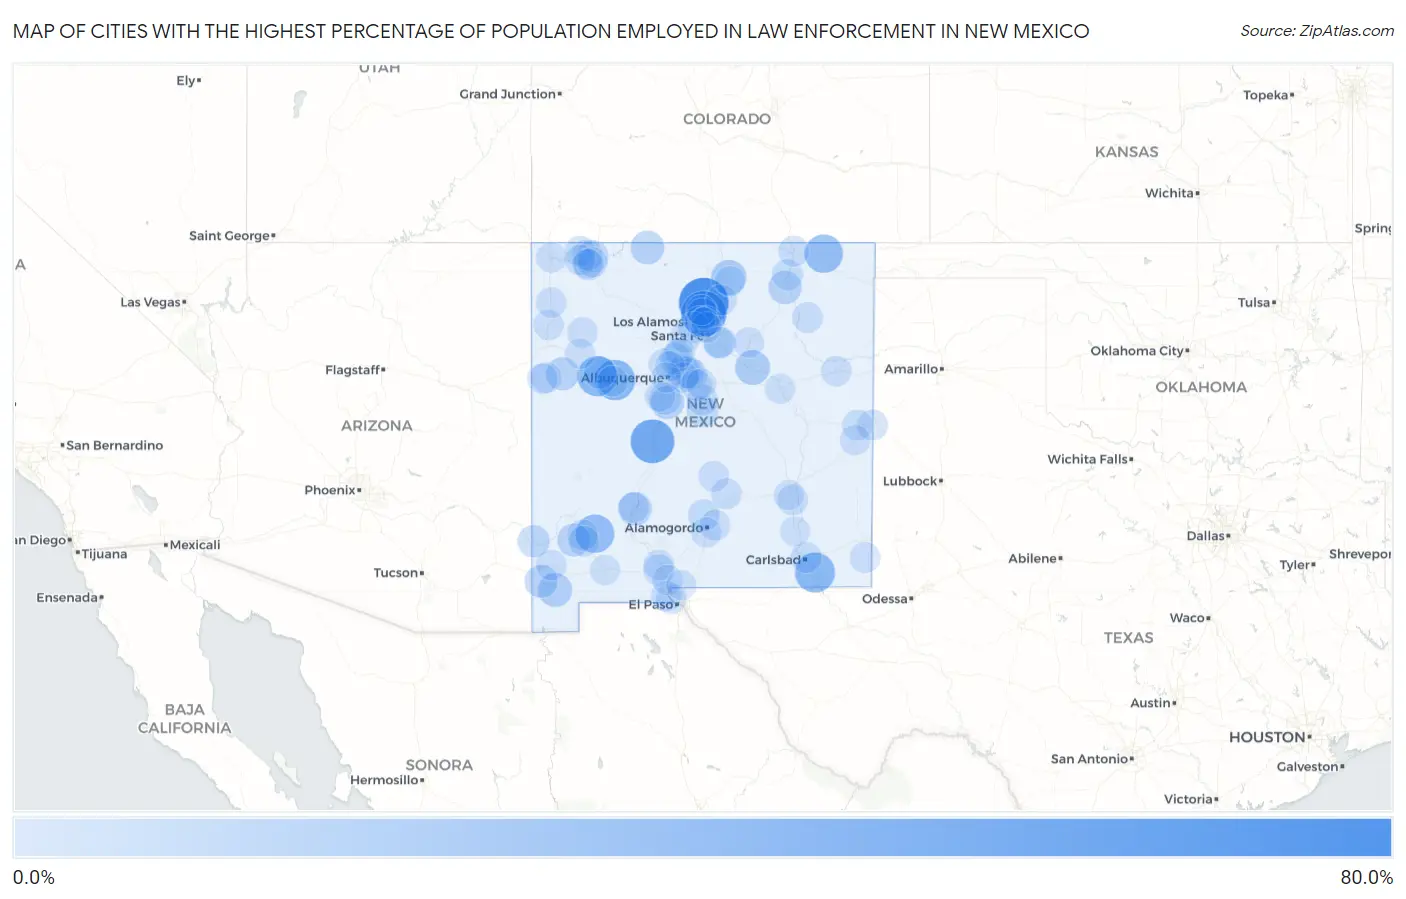
Cities with the Highest Percentage of Population Employed in Law Enforcement in New Mexico
| City | % Employed | vs State | vs National | |
| 1. | Lyden | 63.5% | 1.2%(+62.2)#1 | 0.96%(+62.5)#5 |
| 2. | Cuartelez | 49.7% | 1.2%(+48.5)#2 | 0.96%(+48.8)#12 |
| 3. | Lemitar | 44.3% | 1.2%(+43.0)#3 | 0.96%(+43.3)#18 |
| 4. | South Acomita Village | 33.3% | 1.2%(+32.1)#4 | 0.96%(+32.4)#43 |
| 5. | San Rafael | 32.6% | 1.2%(+31.4)#5 | 0.96%(+31.7)#48 |
| 6. | Malaga | 31.9% | 1.2%(+30.6)#6 | 0.96%(+30.9)#52 |
| 7. | San Lorenzo | 27.5% | 1.2%(+26.3)#7 | 0.96%(+26.5)#69 |
| 8. | Folsom | 26.7% | 1.2%(+25.4)#8 | 0.96%(+25.7)#76 |
| 9. | Arroyo Seco | 16.4% | 1.2%(+15.1)#9 | 0.96%(+15.4)#183 |
| 10. | Tecolotito | 15.2% | 1.2%(+13.9)#10 | 0.96%(+14.2)#204 |
| 11. | Windmill | 13.0% | 1.2%(+11.8)#11 | 0.96%(+12.1)#276 |
| 12. | White Cliffs | 12.4% | 1.2%(+11.2)#12 | 0.96%(+11.5)#304 |
| 13. | Elephant Butte | 11.8% | 1.2%(+10.5)#13 | 0.96%(+10.8)#340 |
| 14. | Dulce | 11.5% | 1.2%(+10.2)#14 | 0.96%(+10.5)#363 |
| 15. | Las Maravillas | 11.3% | 1.2%(+10.1)#15 | 0.96%(+10.3)#373 |
| 16. | Springer | 10.5% | 1.2%(+9.28)#16 | 0.96%(+9.56)#439 |
| 17. | Ramah | 9.9% | 1.2%(+8.65)#17 | 0.96%(+8.93)#480 |
| 18. | Tyrone | 9.7% | 1.2%(+8.48)#18 | 0.96%(+8.76)#492 |
| 19. | Cotton City | 9.7% | 1.2%(+8.43)#19 | 0.96%(+8.71)#497 |
| 20. | Sandia Park | 9.5% | 1.2%(+8.28)#20 | 0.96%(+8.56)#515 |
| 21. | Grants | 8.1% | 1.2%(+6.88)#21 | 0.96%(+7.17)#719 |
| 22. | Virden | 7.4% | 1.2%(+6.16)#22 | 0.96%(+6.44)#841 |
| 23. | La Cueva | 6.4% | 1.2%(+5.20)#23 | 0.96%(+5.48)#1,085 |
| 24. | El Cerro | 6.1% | 1.2%(+4.89)#24 | 0.96%(+5.17)#1,177 |
| 25. | Willard | 5.6% | 1.2%(+4.36)#25 | 0.96%(+4.64)#1,367 |
| 26. | Aztec | 5.5% | 1.2%(+4.30)#26 | 0.96%(+4.58)#1,385 |
| 27. | Tularosa | 5.1% | 1.2%(+3.81)#27 | 0.96%(+4.09)#1,608 |
| 28. | Sandia Knolls | 5.0% | 1.2%(+3.73)#28 | 0.96%(+4.01)#1,644 |
| 29. | White Rock | 5.0% | 1.2%(+3.71)#29 | 0.96%(+4.00)#1,652 |
| 30. | Edgewood | 4.5% | 1.2%(+3.27)#30 | 0.96%(+3.55)#1,884 |
| 31. | Santa Ana Pueblo | 4.4% | 1.2%(+3.15)#31 | 0.96%(+3.43)#1,972 |
| 32. | Maxwell | 4.2% | 1.2%(+2.96)#32 | 0.96%(+3.24)#2,107 |
| 33. | Estancia | 4.1% | 1.2%(+2.89)#33 | 0.96%(+3.17)#2,166 |
| 34. | Paa-Ko | 4.0% | 1.2%(+2.72)#34 | 0.96%(+3.01)#2,301 |
| 35. | Glorieta | 4.0% | 1.2%(+2.72)#35 | 0.96%(+3.01)#2,302 |
| 36. | Indian Hills | 3.9% | 1.2%(+2.65)#36 | 0.96%(+2.93)#2,357 |
| 37. | La Huerta | 3.6% | 1.2%(+2.39)#37 | 0.96%(+2.67)#2,602 |
| 38. | Mesilla | 3.5% | 1.2%(+2.28)#38 | 0.96%(+2.56)#2,694 |
| 39. | Santa Clara | 3.5% | 1.2%(+2.22)#39 | 0.96%(+2.51)#2,749 |
| 40. | Santa Cruz | 3.3% | 1.2%(+2.05)#40 | 0.96%(+2.33)#2,933 |
| 41. | Picuris Pueblo | 3.2% | 1.2%(+1.98)#41 | 0.96%(+2.26)#3,014 |
| 42. | Algodones | 3.2% | 1.2%(+1.95)#42 | 0.96%(+2.23)#3,065 |
| 43. | Black Rock | 3.1% | 1.2%(+1.81)#43 | 0.96%(+2.09)#3,236 |
| 44. | Hurley | 3.0% | 1.2%(+1.75)#44 | 0.96%(+2.03)#3,331 |
| 45. | Little Walnut | 2.9% | 1.2%(+1.71)#45 | 0.96%(+1.99)#3,401 |
| 46. | West Hammond | 2.8% | 1.2%(+1.56)#46 | 0.96%(+1.84)#3,639 |
| 47. | Texico | 2.8% | 1.2%(+1.51)#47 | 0.96%(+1.80)#3,709 |
| 48. | Raton | 2.7% | 1.2%(+1.49)#48 | 0.96%(+1.77)#3,748 |
| 49. | Ruidoso | 2.7% | 1.2%(+1.48)#49 | 0.96%(+1.76)#3,770 |
| 50. | Roy | 2.7% | 1.2%(+1.48)#50 | 0.96%(+1.76)#3,771 |
| 51. | Midway | 2.7% | 1.2%(+1.47)#51 | 0.96%(+1.75)#3,777 |
| 52. | Spencerville | 2.7% | 1.2%(+1.44)#52 | 0.96%(+1.72)#3,821 |
| 53. | Skyline Ganipa | 2.7% | 1.2%(+1.42)#53 | 0.96%(+1.70)#3,848 |
| 54. | Los Lunas | 2.7% | 1.2%(+1.42)#54 | 0.96%(+1.70)#3,864 |
| 55. | La Plata | 2.5% | 1.2%(+1.27)#55 | 0.96%(+1.56)#4,149 |
| 56. | Farmington | 2.5% | 1.2%(+1.26)#56 | 0.96%(+1.54)#4,180 |
| 57. | Lordsburg | 2.4% | 1.2%(+1.20)#57 | 0.96%(+1.48)#4,306 |
| 58. | High Rolls | 2.4% | 1.2%(+1.16)#58 | 0.96%(+1.44)#4,376 |
| 59. | Sunland Park | 2.4% | 1.2%(+1.12)#59 | 0.96%(+1.40)#4,458 |
| 60. | Zuni Pueblo | 2.3% | 1.2%(+1.08)#60 | 0.96%(+1.36)#4,556 |
| 61. | Tijeras | 2.3% | 1.2%(+1.02)#61 | 0.96%(+1.30)#4,690 |
| 62. | Tohatchi | 2.2% | 1.2%(+0.998)#62 | 0.96%(+1.28)#4,739 |
| 63. | Cannon Afb | 2.2% | 1.2%(+0.988)#63 | 0.96%(+1.27)#4,762 |
| 64. | Carrizozo | 2.2% | 1.2%(+0.978)#64 | 0.96%(+1.26)#4,778 |
| 65. | Crownpoint | 2.2% | 1.2%(+0.969)#65 | 0.96%(+1.25)#4,814 |
| 66. | Eunice | 2.1% | 1.2%(+0.873)#66 | 0.96%(+1.15)#5,018 |
| 67. | Las Vegas | 2.1% | 1.2%(+0.824)#67 | 0.96%(+1.11)#5,153 |
| 68. | Santa Teresa | 2.0% | 1.2%(+0.803)#68 | 0.96%(+1.08)#5,209 |
| 69. | Las Campanas | 2.0% | 1.2%(+0.776)#69 | 0.96%(+1.06)#5,276 |
| 70. | Sheep Springs | 2.0% | 1.2%(+0.736)#70 | 0.96%(+1.02)#5,390 |
| 71. | El Rancho | 1.9% | 1.2%(+0.648)#71 | 0.96%(+0.930)#5,634 |
| 72. | Las Cruces | 1.9% | 1.2%(+0.622)#72 | 0.96%(+0.903)#5,708 |
| 73. | Cochiti Lake | 1.8% | 1.2%(+0.585)#73 | 0.96%(+0.867)#5,813 |
| 74. | Tesuque Pueblo | 1.8% | 1.2%(+0.552)#74 | 0.96%(+0.834)#5,914 |
| 75. | Tucumcari | 1.8% | 1.2%(+0.535)#75 | 0.96%(+0.816)#5,970 |
| 76. | Vado | 1.8% | 1.2%(+0.522)#76 | 0.96%(+0.803)#6,031 |
| 77. | Boles Acres | 1.7% | 1.2%(+0.504)#77 | 0.96%(+0.786)#6,096 |
| 78. | Truth Or Consequences | 1.7% | 1.2%(+0.418)#78 | 0.96%(+0.699)#6,406 |
| 79. | Nambe | 1.6% | 1.2%(+0.387)#79 | 0.96%(+0.668)#6,502 |
| 80. | Kirtland Afb | 1.6% | 1.2%(+0.378)#80 | 0.96%(+0.660)#6,534 |
| 81. | Portales | 1.5% | 1.2%(+0.286)#81 | 0.96%(+0.567)#6,896 |
| 82. | Shiprock | 1.5% | 1.2%(+0.248)#82 | 0.96%(+0.529)#7,052 |
| 83. | Rio Rancho | 1.5% | 1.2%(+0.208)#83 | 0.96%(+0.490)#7,209 |
| 84. | Deming | 1.4% | 1.2%(+0.171)#84 | 0.96%(+0.452)#7,392 |
| 85. | Espanola | 1.4% | 1.2%(+0.158)#85 | 0.96%(+0.439)#7,459 |
| 86. | Thoreau | 1.3% | 1.2%(+0.080)#86 | 0.96%(+0.361)#7,820 |
| 87. | Taos Pueblo | 1.3% | 1.2%(+0.062)#87 | 0.96%(+0.343)#7,902 |
| 88. | Roswell | 1.3% | 1.2%(+0.041)#88 | 0.96%(+0.323)#7,987 |
| 89. | San Jose Cdp Rio Arriba County | 1.2% | 1.2%(-0.021)#89 | 0.96%(+0.261)#8,285 |
| 90. | Santa Rosa | 1.2% | 1.2%(-0.080)#90 | 0.96%(+0.202)#8,583 |
| 91. | Bloomfield | 1.1% | 1.2%(-0.155)#91 | 0.96%(+0.127)#9,002 |
| 92. | San Felipe Pueblo | 1.1% | 1.2%(-0.171)#92 | 0.96%(+0.110)#9,103 |
| 93. | Artesia | 1.1% | 1.2%(-0.174)#93 | 0.96%(+0.108)#9,120 |
| 94. | Chaparral | 1.1% | 1.2%(-0.178)#94 | 0.96%(+0.104)#9,141 |
| 95. | Corrales | 1.00% | 1.2%(-0.245)#95 | 0.96%(+0.037)#9,522 |
| 96. | Ohkay Owingeh | 0.97% | 1.2%(-0.269)#96 | 0.96%(+0.012)#9,661 |
| 97. | Lee Acres | 0.96% | 1.2%(-0.282)#97 | 0.96%(-0.000)#9,728 |
| 98. | Cuyamungue | 0.95% | 1.2%(-0.292)#98 | 0.96%(-0.010)#9,795 |
| 99. | Albuquerque | 0.92% | 1.2%(-0.322)#99 | 0.96%(-0.041)#9,962 |
| 100. | Moriarty | 0.92% | 1.2%(-0.329)#100 | 0.96%(-0.048)#9,993 |
Common Questions
What are the Top 10 Cities with the Highest Percentage of Population Employed in Law Enforcement in New Mexico?
Top 10 Cities with the Highest Percentage of Population Employed in Law Enforcement in New Mexico are:
#1
63.5%
#2
49.7%
#3
44.3%
#4
33.3%
#5
32.6%
#6
31.9%
#7
27.5%
#8
26.7%
#9
16.4%
#10
15.2%
What city has the Highest Percentage of Population Employed in Law Enforcement in New Mexico?
Lyden has the Highest Percentage of Population Employed in Law Enforcement in New Mexico with 63.5%.
What is the Percentage of Population Employed in Law Enforcement in the State of New Mexico?
Percentage of Population Employed in Law Enforcement in New Mexico is 1.2%.
What is the Percentage of Population Employed in Law Enforcement in the United States?
Percentage of Population Employed in Law Enforcement in the United States is 0.96%.