Cities with the Highest Percentage of Population Employed in Law Enforcement in Texas
RELATED REPORTS & OPTIONS
Law Enforcement
Texas
Compare Cities
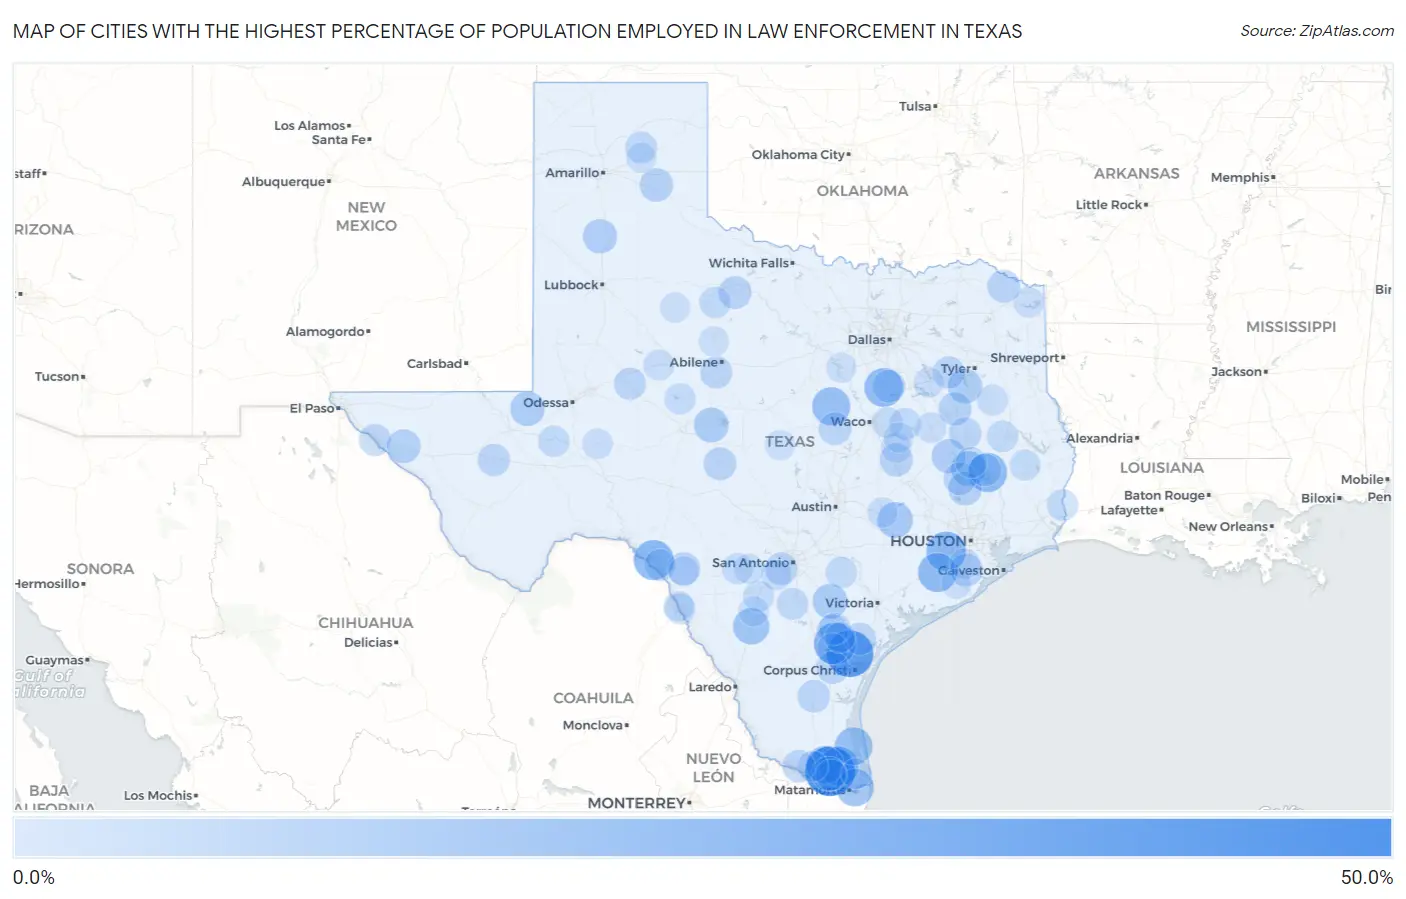
Map of Cities with the Highest Percentage of Population Employed in Law Enforcement in Texas
0.0%
50.0%
Cities with the Highest Percentage of Population Employed in Law Enforcement in Texas
| City | % Employed | vs State | vs National | |
| 1. | Solis | 47.9% | 1.1%(+46.8)#1 | 0.96%(+47.0)#13 |
| 2. | Loma Linda | 41.8% | 1.1%(+40.7)#2 | 0.96%(+40.8)#22 |
| 3. | Paige | 33.9% | 1.1%(+32.8)#3 | 0.96%(+32.9)#40 |
| 4. | Tynan | 31.6% | 1.1%(+30.5)#4 | 0.96%(+30.7)#54 |
| 5. | Lake View | 27.1% | 1.1%(+26.0)#5 | 0.96%(+26.1)#74 |
| 6. | Cumings | 26.0% | 1.1%(+24.9)#6 | 0.96%(+25.0)#82 |
| 7. | Cedar Point | 25.5% | 1.1%(+24.4)#7 | 0.96%(+24.5)#86 |
| 8. | Lasana | 25.3% | 1.1%(+24.2)#8 | 0.96%(+24.4)#87 |
| 9. | May | 25.3% | 1.1%(+24.2)#9 | 0.96%(+24.3)#88 |
| 10. | Iago | 25.0% | 1.1%(+23.9)#10 | 0.96%(+24.0)#96 |
| 11. | Mertens | 24.5% | 1.1%(+23.4)#11 | 0.96%(+23.5)#99 |
| 12. | Cranfills Gap | 23.1% | 1.1%(+22.0)#12 | 0.96%(+22.1)#107 |
| 13. | Port Mansfield | 22.2% | 1.1%(+21.1)#13 | 0.96%(+21.3)#112 |
| 14. | Reid Hope King | 22.2% | 1.1%(+21.1)#14 | 0.96%(+21.2)#115 |
| 15. | Laguna Seca | 22.1% | 1.1%(+21.0)#15 | 0.96%(+21.1)#116 |
| 16. | Cotulla | 19.6% | 1.1%(+18.5)#16 | 0.96%(+18.6)#131 |
| 17. | Round Top | 17.7% | 1.1%(+16.6)#17 | 0.96%(+16.8)#156 |
| 18. | Riverside | 17.1% | 1.1%(+16.0)#18 | 0.96%(+16.2)#166 |
| 19. | Kenedy | 16.4% | 1.1%(+15.3)#19 | 0.96%(+15.5)#182 |
| 20. | Paint Rock | 16.1% | 1.1%(+15.0)#20 | 0.96%(+15.1)#188 |
| 21. | Wink | 15.4% | 1.1%(+14.3)#21 | 0.96%(+14.5)#200 |
| 22. | Berryville | 15.3% | 1.1%(+14.2)#22 | 0.96%(+14.4)#203 |
| 23. | Edmonson | 15.1% | 1.1%(+14.0)#23 | 0.96%(+14.1)#206 |
| 24. | Bixby | 15.0% | 1.1%(+13.9)#24 | 0.96%(+14.1)#209 |
| 25. | Midway | 15.0% | 1.1%(+13.9)#25 | 0.96%(+14.0)#211 |
| 26. | East Columbia | 14.5% | 1.1%(+13.4)#26 | 0.96%(+13.6)#221 |
| 27. | Sierra Blanca | 14.1% | 1.1%(+13.0)#27 | 0.96%(+13.1)#236 |
| 28. | New Waverly | 13.4% | 1.1%(+12.3)#28 | 0.96%(+12.4)#261 |
| 29. | Howardwick | 13.3% | 1.1%(+12.2)#29 | 0.96%(+12.4)#262 |
| 30. | Mound | 13.2% | 1.1%(+12.1)#30 | 0.96%(+12.2)#268 |
| 31. | Calvert | 12.8% | 1.1%(+11.7)#31 | 0.96%(+11.8)#285 |
| 32. | Palestine | 12.7% | 1.1%(+11.6)#32 | 0.96%(+11.7)#295 |
| 33. | Brackettville | 12.4% | 1.1%(+11.3)#33 | 0.96%(+11.4)#306 |
| 34. | Goree | 12.3% | 1.1%(+11.2)#34 | 0.96%(+11.3)#311 |
| 35. | Menard | 12.2% | 1.1%(+11.1)#35 | 0.96%(+11.3)#315 |
| 36. | Avery | 12.1% | 1.1%(+11.0)#36 | 0.96%(+11.1)#323 |
| 37. | Bonney | 11.9% | 1.1%(+10.8)#37 | 0.96%(+11.0)#331 |
| 38. | Gatesville | 11.8% | 1.1%(+10.7)#38 | 0.96%(+10.8)#339 |
| 39. | Frost | 11.8% | 1.1%(+10.7)#39 | 0.96%(+10.8)#342 |
| 40. | Macdona | 11.8% | 1.1%(+10.7)#40 | 0.96%(+10.8)#343 |
| 41. | Latexo | 11.8% | 1.1%(+10.7)#41 | 0.96%(+10.8)#345 |
| 42. | Huntsville | 11.8% | 1.1%(+10.7)#42 | 0.96%(+10.8)#350 |
| 43. | Banquete | 11.6% | 1.1%(+10.5)#43 | 0.96%(+10.6)#361 |
| 44. | Perezville | 11.5% | 1.1%(+10.4)#44 | 0.96%(+10.5)#364 |
| 45. | Premont | 11.3% | 1.1%(+10.2)#45 | 0.96%(+10.4)#371 |
| 46. | Onalaska | 11.2% | 1.1%(+10.2)#46 | 0.96%(+10.3)#379 |
| 47. | Balmorhea | 11.1% | 1.1%(+9.98)#47 | 0.96%(+10.1)#401 |
| 48. | Woodsboro | 10.9% | 1.1%(+9.84)#48 | 0.96%(+9.97)#411 |
| 49. | Buffalo Gap | 10.7% | 1.1%(+9.60)#49 | 0.96%(+9.74)#426 |
| 50. | Forsan | 10.7% | 1.1%(+9.58)#50 | 0.96%(+9.71)#429 |
| 51. | Murchison | 10.6% | 1.1%(+9.54)#51 | 0.96%(+9.68)#431 |
| 52. | Fort Hancock | 10.6% | 1.1%(+9.49)#52 | 0.96%(+9.62)#435 |
| 53. | Skellytown | 10.0% | 1.1%(+8.90)#53 | 0.96%(+9.04)#469 |
| 54. | Christine | 10.0% | 1.1%(+8.90)#54 | 0.96%(+9.04)#472 |
| 55. | Beeville | 9.8% | 1.1%(+8.75)#55 | 0.96%(+8.88)#481 |
| 56. | Val Verde Park | 9.7% | 1.1%(+8.58)#56 | 0.96%(+8.71)#495 |
| 57. | Groesbeck | 9.5% | 1.1%(+8.36)#57 | 0.96%(+8.50)#523 |
| 58. | Hudson | 9.4% | 1.1%(+8.35)#58 | 0.96%(+8.49)#527 |
| 59. | Smiley | 9.3% | 1.1%(+8.21)#59 | 0.96%(+8.34)#542 |
| 60. | Deweyville | 9.3% | 1.1%(+8.17)#60 | 0.96%(+8.31)#549 |
| 61. | Rochester | 9.2% | 1.1%(+8.14)#61 | 0.96%(+8.27)#554 |
| 62. | Imperial | 9.1% | 1.1%(+8.00)#62 | 0.96%(+8.13)#571 |
| 63. | Lakeside Town San Patricio County | 8.9% | 1.1%(+7.79)#63 | 0.96%(+7.93)#600 |
| 64. | Robert Lee | 8.9% | 1.1%(+7.78)#64 | 0.96%(+7.91)#603 |
| 65. | Blue Berry Hill | 8.9% | 1.1%(+7.77)#65 | 0.96%(+7.90)#604 |
| 66. | Sabinal | 8.7% | 1.1%(+7.62)#66 | 0.96%(+7.75)#624 |
| 67. | La Feria | 8.5% | 1.1%(+7.43)#67 | 0.96%(+7.56)#648 |
| 68. | Eagle Pass | 8.5% | 1.1%(+7.38)#68 | 0.96%(+7.52)#654 |
| 69. | Pearsall | 8.5% | 1.1%(+7.36)#69 | 0.96%(+7.49)#658 |
| 70. | Trinity | 8.4% | 1.1%(+7.34)#70 | 0.96%(+7.48)#661 |
| 71. | Colmesneil | 8.4% | 1.1%(+7.32)#71 | 0.96%(+7.45)#669 |
| 72. | Reklaw | 8.3% | 1.1%(+7.24)#72 | 0.96%(+7.37)#679 |
| 73. | Rochelle | 8.3% | 1.1%(+7.19)#73 | 0.96%(+7.32)#688 |
| 74. | Mart | 8.2% | 1.1%(+7.11)#74 | 0.96%(+7.25)#705 |
| 75. | Mathis | 8.2% | 1.1%(+7.09)#75 | 0.96%(+7.22)#710 |
| 76. | Colorado City | 8.2% | 1.1%(+7.08)#76 | 0.96%(+7.21)#712 |
| 77. | Lopezville | 7.9% | 1.1%(+6.79)#77 | 0.96%(+6.92)#753 |
| 78. | Lytle | 7.5% | 1.1%(+6.44)#78 | 0.96%(+6.58)#815 |
| 79. | Huckabay | 7.5% | 1.1%(+6.44)#79 | 0.96%(+6.57)#816 |
| 80. | Buffalo | 7.5% | 1.1%(+6.40)#80 | 0.96%(+6.54)#817 |
| 81. | Skidmore | 7.4% | 1.1%(+6.35)#81 | 0.96%(+6.48)#832 |
| 82. | Rankin | 7.4% | 1.1%(+6.31)#82 | 0.96%(+6.44)#839 |
| 83. | Trinidad | 7.4% | 1.1%(+6.28)#83 | 0.96%(+6.41)#849 |
| 84. | Sandy Point | 7.3% | 1.1%(+6.22)#84 | 0.96%(+6.35)#858 |
| 85. | Bayview | 7.2% | 1.1%(+6.14)#85 | 0.96%(+6.27)#873 |
| 86. | Maud | 7.1% | 1.1%(+6.03)#86 | 0.96%(+6.16)#898 |
| 87. | Giddings | 7.1% | 1.1%(+5.99)#87 | 0.96%(+6.12)#919 |
| 88. | Bremond | 7.0% | 1.1%(+5.95)#88 | 0.96%(+6.09)#926 |
| 89. | Sargent | 7.0% | 1.1%(+5.91)#89 | 0.96%(+6.05)#933 |
| 90. | Jayton | 7.0% | 1.1%(+5.90)#90 | 0.96%(+6.03)#937 |
| 91. | Anson | 7.0% | 1.1%(+5.88)#91 | 0.96%(+6.01)#949 |
| 92. | Dilley | 6.9% | 1.1%(+5.84)#92 | 0.96%(+5.97)#953 |
| 93. | Pecan Plantation | 6.9% | 1.1%(+5.77)#93 | 0.96%(+5.90)#968 |
| 94. | Seco Mines | 6.8% | 1.1%(+5.71)#94 | 0.96%(+5.84)#980 |
| 95. | White Deer | 6.8% | 1.1%(+5.67)#95 | 0.96%(+5.81)#990 |
| 96. | Fort Clark Springs | 6.8% | 1.1%(+5.66)#96 | 0.96%(+5.80)#994 |
| 97. | San Saba | 6.7% | 1.1%(+5.58)#97 | 0.96%(+5.71)#1,015 |
| 98. | D Hanis | 6.7% | 1.1%(+5.57)#98 | 0.96%(+5.70)#1,018 |
| 99. | Kosse | 6.7% | 1.1%(+5.57)#99 | 0.96%(+5.70)#1,019 |
| 100. | Wild Peach Village | 6.7% | 1.1%(+5.55)#100 | 0.96%(+5.69)#1,028 |
Common Questions
What are the Top 10 Cities with the Highest Percentage of Population Employed in Law Enforcement in Texas?
Top 10 Cities with the Highest Percentage of Population Employed in Law Enforcement in Texas are:
#1
47.9%
#2
41.8%
#3
31.6%
#4
27.1%
#5
26.0%
#6
25.5%
#7
25.3%
#8
25.0%
#9
24.5%
#10
23.1%
What city has the Highest Percentage of Population Employed in Law Enforcement in Texas?
Solis has the Highest Percentage of Population Employed in Law Enforcement in Texas with 47.9%.
What is the Percentage of Population Employed in Law Enforcement in the State of Texas?
Percentage of Population Employed in Law Enforcement in Texas is 1.1%.
What is the Percentage of Population Employed in Law Enforcement in the United States?
Percentage of Population Employed in Law Enforcement in the United States is 0.96%.