Cities with the Highest Percentage of Population Employed in Health Care & Social Assistance in Virginia
RELATED REPORTS & OPTIONS
Health Care & Social Assistance
Virginia
Compare Cities
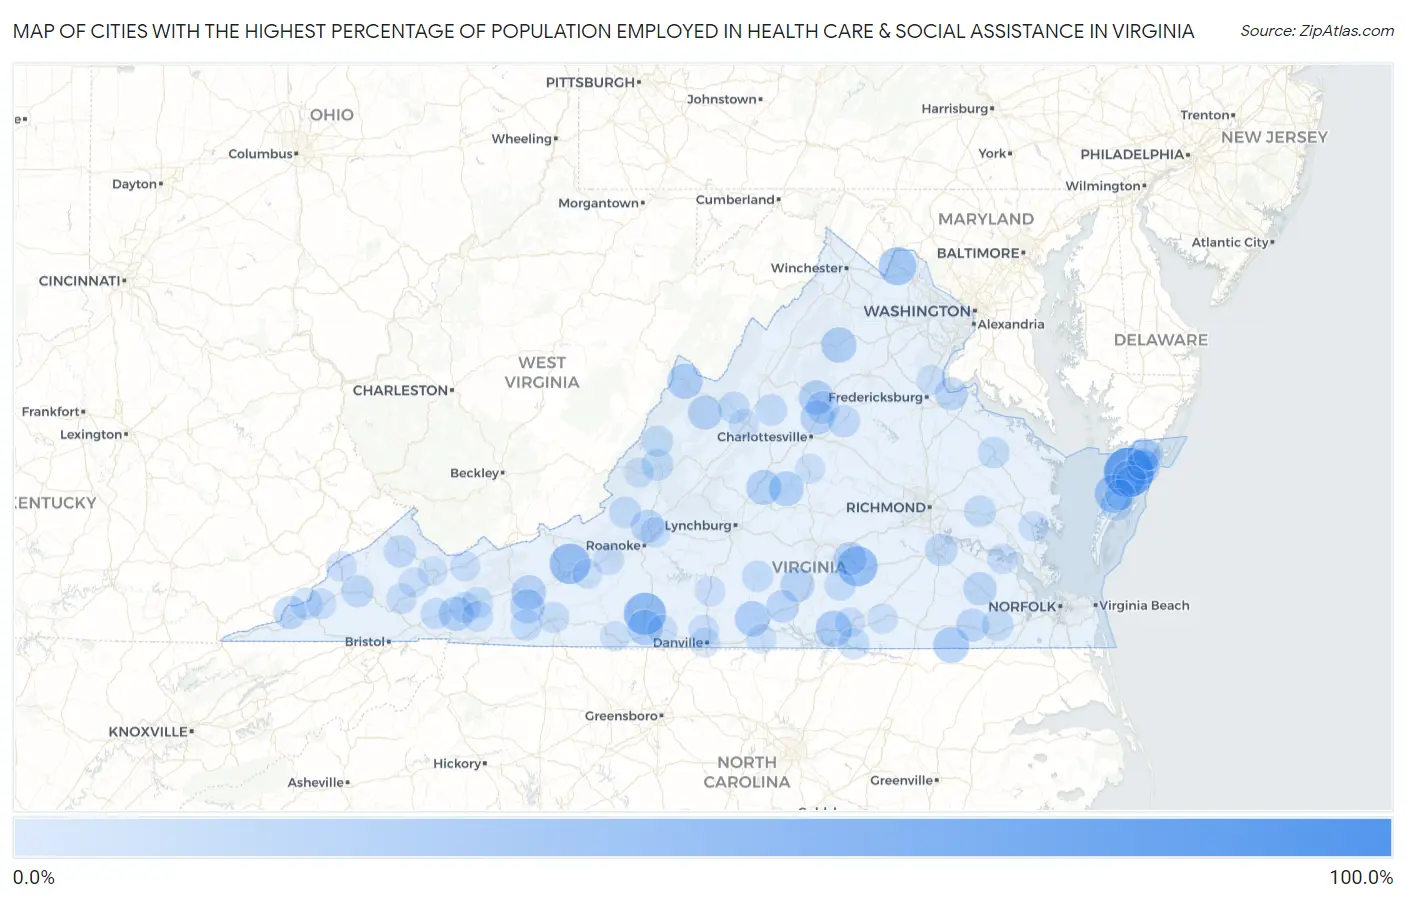
Map of Cities with the Highest Percentage of Population Employed in Health Care & Social Assistance in Virginia
0.0%
100.0%
Cities with the Highest Percentage of Population Employed in Health Care & Social Assistance in Virginia
| City | % Employed | vs State | vs National | |
| 1. | Paris | 100.0% | 12.3%(+87.7)#1 | 13.9%(+86.1)#33 |
| 2. | Jewell Ridge | 100.0% | 12.3%(+87.7)#2 | 13.9%(+86.1)#44 |
| 3. | Lee Mont | 79.2% | 12.3%(+66.9)#3 | 13.9%(+65.2)#91 |
| 4. | Osaka | 63.6% | 12.3%(+51.3)#4 | 13.9%(+49.7)#158 |
| 5. | Oak Level | 55.9% | 12.3%(+43.6)#5 | 13.9%(+41.9)#227 |
| 6. | Stevens Creek | 54.3% | 12.3%(+42.0)#6 | 13.9%(+40.4)#256 |
| 7. | Fairfield | 53.0% | 12.3%(+40.7)#7 | 13.9%(+39.1)#278 |
| 8. | New River | 51.1% | 12.3%(+38.8)#8 | 13.9%(+37.2)#311 |
| 9. | Nottoway Court House | 50.0% | 12.3%(+37.7)#9 | 13.9%(+36.1)#326 |
| 10. | Rose Hill Cdp Lee County | 47.6% | 12.3%(+35.3)#10 | 13.9%(+33.7)#381 |
| 11. | Pungoteague | 43.8% | 12.3%(+31.5)#11 | 13.9%(+29.8)#477 |
| 12. | Hillsboro | 43.0% | 12.3%(+30.7)#12 | 13.9%(+29.1)#493 |
| 13. | Baskerville | 37.8% | 12.3%(+25.5)#13 | 13.9%(+23.8)#695 |
| 14. | Branchville | 36.9% | 12.3%(+24.6)#14 | 13.9%(+23.0)#739 |
| 15. | Fieldale | 36.0% | 12.3%(+23.7)#15 | 13.9%(+22.1)#798 |
| 16. | Monterey | 35.4% | 12.3%(+23.1)#16 | 13.9%(+21.5)#847 |
| 17. | Sperryville | 35.4% | 12.3%(+23.1)#17 | 13.9%(+21.4)#850 |
| 18. | Mountain Road | 35.4% | 12.3%(+23.1)#18 | 13.9%(+21.4)#851 |
| 19. | Kincora | 34.9% | 12.3%(+22.6)#19 | 13.9%(+20.9)#886 |
| 20. | Port Republic | 34.8% | 12.3%(+22.5)#20 | 13.9%(+20.8)#898 |
| 21. | Arrington | 33.9% | 12.3%(+21.6)#21 | 13.9%(+19.9)#974 |
| 22. | Yogaville | 33.8% | 12.3%(+21.6)#22 | 13.9%(+19.9)#977 |
| 23. | Fort Chiswell | 33.3% | 12.3%(+21.0)#23 | 13.9%(+19.3)#1,065 |
| 24. | Modest Town | 33.0% | 12.3%(+20.7)#24 | 13.9%(+19.1)#1,080 |
| 25. | Stewartsville | 32.9% | 12.3%(+20.6)#25 | 13.9%(+19.0)#1,083 |
| 26. | Stanardsville | 32.8% | 12.3%(+20.5)#26 | 13.9%(+18.8)#1,096 |
| 27. | Adwolf | 32.5% | 12.3%(+20.2)#27 | 13.9%(+18.5)#1,126 |
| 28. | Ivanhoe | 32.3% | 12.3%(+20.0)#28 | 13.9%(+18.3)#1,149 |
| 29. | Greenbush | 31.8% | 12.3%(+19.5)#29 | 13.9%(+17.9)#1,220 |
| 30. | Deerfield | 31.8% | 12.3%(+19.5)#30 | 13.9%(+17.8)#1,228 |
| 31. | Piney Mountain | 31.7% | 12.3%(+19.5)#31 | 13.9%(+17.8)#1,232 |
| 32. | Big Stone Gap East | 31.2% | 12.3%(+18.9)#32 | 13.9%(+17.2)#1,310 |
| 33. | Drakes Branch | 30.9% | 12.3%(+18.6)#33 | 13.9%(+17.0)#1,336 |
| 34. | Cliftondale Park | 30.8% | 12.3%(+18.5)#34 | 13.9%(+16.8)#1,355 |
| 35. | Baywood | 30.2% | 12.3%(+17.9)#35 | 13.9%(+16.3)#1,434 |
| 36. | Bastian | 30.1% | 12.3%(+17.8)#36 | 13.9%(+16.2)#1,450 |
| 37. | Crewe | 30.0% | 12.3%(+17.8)#37 | 13.9%(+16.1)#1,459 |
| 38. | Wakefield | 29.6% | 12.3%(+17.3)#38 | 13.9%(+15.7)#1,533 |
| 39. | Daleville | 28.8% | 12.3%(+16.5)#39 | 13.9%(+14.9)#1,671 |
| 40. | Temperanceville | 28.8% | 12.3%(+16.5)#40 | 13.9%(+14.9)#1,673 |
| 41. | St Charles | 28.6% | 12.3%(+16.3)#41 | 13.9%(+14.6)#1,726 |
| 42. | Courtland | 28.3% | 12.3%(+16.0)#42 | 13.9%(+14.4)#1,786 |
| 43. | Ruckersville | 28.2% | 12.3%(+16.0)#43 | 13.9%(+14.3)#1,796 |
| 44. | Fairview Beach | 28.1% | 12.3%(+15.8)#44 | 13.9%(+14.1)#1,827 |
| 45. | Clover | 27.5% | 12.3%(+15.2)#45 | 13.9%(+13.6)#1,934 |
| 46. | Glen Wilton | 27.3% | 12.3%(+15.0)#46 | 13.9%(+13.3)#1,982 |
| 47. | Vansant | 26.7% | 12.3%(+14.4)#47 | 13.9%(+12.8)#2,098 |
| 48. | Fort Lee | 26.7% | 12.3%(+14.4)#48 | 13.9%(+12.8)#2,112 |
| 49. | Gordonsville | 26.5% | 12.3%(+14.2)#49 | 13.9%(+12.6)#2,168 |
| 50. | Coeburn | 25.8% | 12.3%(+13.6)#50 | 13.9%(+11.9)#2,341 |
| 51. | Keokee | 25.5% | 12.3%(+13.2)#51 | 13.9%(+11.6)#2,436 |
| 52. | Harriston | 25.5% | 12.3%(+13.2)#52 | 13.9%(+11.5)#2,450 |
| 53. | New Kent | 25.1% | 12.3%(+12.8)#53 | 13.9%(+11.2)#2,564 |
| 54. | Carrsville | 25.0% | 12.3%(+12.7)#54 | 13.9%(+11.1)#2,594 |
| 55. | New Castle | 25.0% | 12.3%(+12.7)#55 | 13.9%(+11.1)#2,596 |
| 56. | Breaks | 25.0% | 12.3%(+12.7)#56 | 13.9%(+11.1)#2,599 |
| 57. | Churchville | 25.0% | 12.3%(+12.7)#57 | 13.9%(+11.1)#2,626 |
| 58. | Clifton Forge | 24.8% | 12.3%(+12.5)#58 | 13.9%(+10.8)#2,723 |
| 59. | Tappahannock | 24.4% | 12.3%(+12.1)#59 | 13.9%(+10.5)#2,826 |
| 60. | Savage Town | 24.3% | 12.3%(+12.1)#60 | 13.9%(+10.4)#2,844 |
| 61. | Hot Springs | 23.8% | 12.3%(+11.5)#61 | 13.9%(+9.87)#3,055 |
| 62. | Barboursville | 23.7% | 12.3%(+11.4)#62 | 13.9%(+9.77)#3,095 |
| 63. | Fries | 23.6% | 12.3%(+11.3)#63 | 13.9%(+9.65)#3,154 |
| 64. | Victoria | 23.5% | 12.3%(+11.2)#64 | 13.9%(+9.53)#3,220 |
| 65. | Glade Spring | 23.3% | 12.3%(+11.0)#65 | 13.9%(+9.35)#3,306 |
| 66. | Bracey | 23.3% | 12.3%(+11.0)#66 | 13.9%(+9.33)#3,312 |
| 67. | Brookneal | 23.0% | 12.3%(+10.7)#67 | 13.9%(+9.10)#3,434 |
| 68. | Boissevain | 23.0% | 12.3%(+10.7)#68 | 13.9%(+9.10)#3,435 |
| 69. | Marion | 23.0% | 12.3%(+10.7)#69 | 13.9%(+9.07)#3,447 |
| 70. | Atkins | 22.9% | 12.3%(+10.6)#70 | 13.9%(+8.98)#3,487 |
| 71. | Sugar Grove | 22.8% | 12.3%(+10.5)#71 | 13.9%(+8.85)#3,543 |
| 72. | Hillsville | 22.7% | 12.3%(+10.4)#72 | 13.9%(+8.79)#3,589 |
| 73. | Accomac | 22.5% | 12.3%(+10.2)#73 | 13.9%(+8.54)#3,689 |
| 74. | Mappsville | 22.4% | 12.3%(+10.1)#74 | 13.9%(+8.44)#3,736 |
| 75. | Lebanon | 21.7% | 12.3%(+9.38)#75 | 13.9%(+7.74)#4,151 |
| 76. | Pound | 21.3% | 12.3%(+9.02)#76 | 13.9%(+7.38)#4,376 |
| 77. | Shawsville | 21.2% | 12.3%(+8.88)#77 | 13.9%(+7.24)#4,487 |
| 78. | Gretna | 21.2% | 12.3%(+8.88)#78 | 13.9%(+7.24)#4,493 |
| 79. | Big Stone Gap | 21.1% | 12.3%(+8.85)#79 | 13.9%(+7.21)#4,512 |
| 80. | Keller | 20.8% | 12.3%(+8.54)#80 | 13.9%(+6.90)#4,759 |
| 81. | Scotland | 20.8% | 12.3%(+8.54)#81 | 13.9%(+6.90)#4,766 |
| 82. | South Hill | 20.8% | 12.3%(+8.49)#82 | 13.9%(+6.85)#4,792 |
| 83. | Laymantown | 20.8% | 12.3%(+8.46)#83 | 13.9%(+6.82)#4,808 |
| 84. | Brucetown | 20.7% | 12.3%(+8.37)#84 | 13.9%(+6.73)#4,890 |
| 85. | Mount Hermon | 20.5% | 12.3%(+8.23)#85 | 13.9%(+6.59)#4,992 |
| 86. | Tazewell | 20.5% | 12.3%(+8.18)#86 | 13.9%(+6.54)#5,028 |
| 87. | Gloucester Courthouse | 20.5% | 12.3%(+8.17)#87 | 13.9%(+6.52)#5,038 |
| 88. | Chatmoss | 20.3% | 12.3%(+8.03)#88 | 13.9%(+6.39)#5,156 |
| 89. | Covington | 20.3% | 12.3%(+7.99)#89 | 13.9%(+6.34)#5,189 |
| 90. | Lawrenceville | 20.1% | 12.3%(+7.82)#90 | 13.9%(+6.18)#5,328 |
| 91. | Cluster Springs | 20.1% | 12.3%(+7.80)#91 | 13.9%(+6.16)#5,346 |
| 92. | Danville | 20.1% | 12.3%(+7.80)#92 | 13.9%(+6.16)#5,347 |
| 93. | Honaker | 20.0% | 12.3%(+7.75)#93 | 13.9%(+6.11)#5,378 |
| 94. | Patrick Springs | 20.0% | 12.3%(+7.71)#94 | 13.9%(+6.06)#5,395 |
| 95. | Scottsville | 20.0% | 12.3%(+7.71)#95 | 13.9%(+6.06)#5,409 |
| 96. | Richlands | 19.9% | 12.3%(+7.61)#96 | 13.9%(+5.97)#5,527 |
| 97. | Jolivue | 19.9% | 12.3%(+7.57)#97 | 13.9%(+5.92)#5,571 |
| 98. | Stafford Courthouse | 19.8% | 12.3%(+7.52)#98 | 13.9%(+5.87)#5,603 |
| 99. | Atlantic | 19.7% | 12.3%(+7.40)#99 | 13.9%(+5.75)#5,708 |
| 100. | Riner | 19.6% | 12.3%(+7.29)#100 | 13.9%(+5.65)#5,802 |
Common Questions
What are the Top 10 Cities with the Highest Percentage of Population Employed in Health Care & Social Assistance in Virginia?
Top 10 Cities with the Highest Percentage of Population Employed in Health Care & Social Assistance in Virginia are:
#1
79.2%
#2
55.9%
#3
51.1%
#4
50.0%
#5
43.8%
#6
43.0%
#7
37.8%
#8
36.9%
#9
36.0%
#10
35.4%
What city has the Highest Percentage of Population Employed in Health Care & Social Assistance in Virginia?
Lee Mont has the Highest Percentage of Population Employed in Health Care & Social Assistance in Virginia with 79.2%.
What is the Percentage of Population Employed in Health Care & Social Assistance in the State of Virginia?
Percentage of Population Employed in Health Care & Social Assistance in Virginia is 12.3%.
What is the Percentage of Population Employed in Health Care & Social Assistance in the United States?
Percentage of Population Employed in Health Care & Social Assistance in the United States is 13.9%.