Cities with the Highest Percentage of Population Employed in Health Care & Social Assistance in Massachusetts
RELATED REPORTS & OPTIONS
Health Care & Social Assistance
Massachusetts
Compare Cities
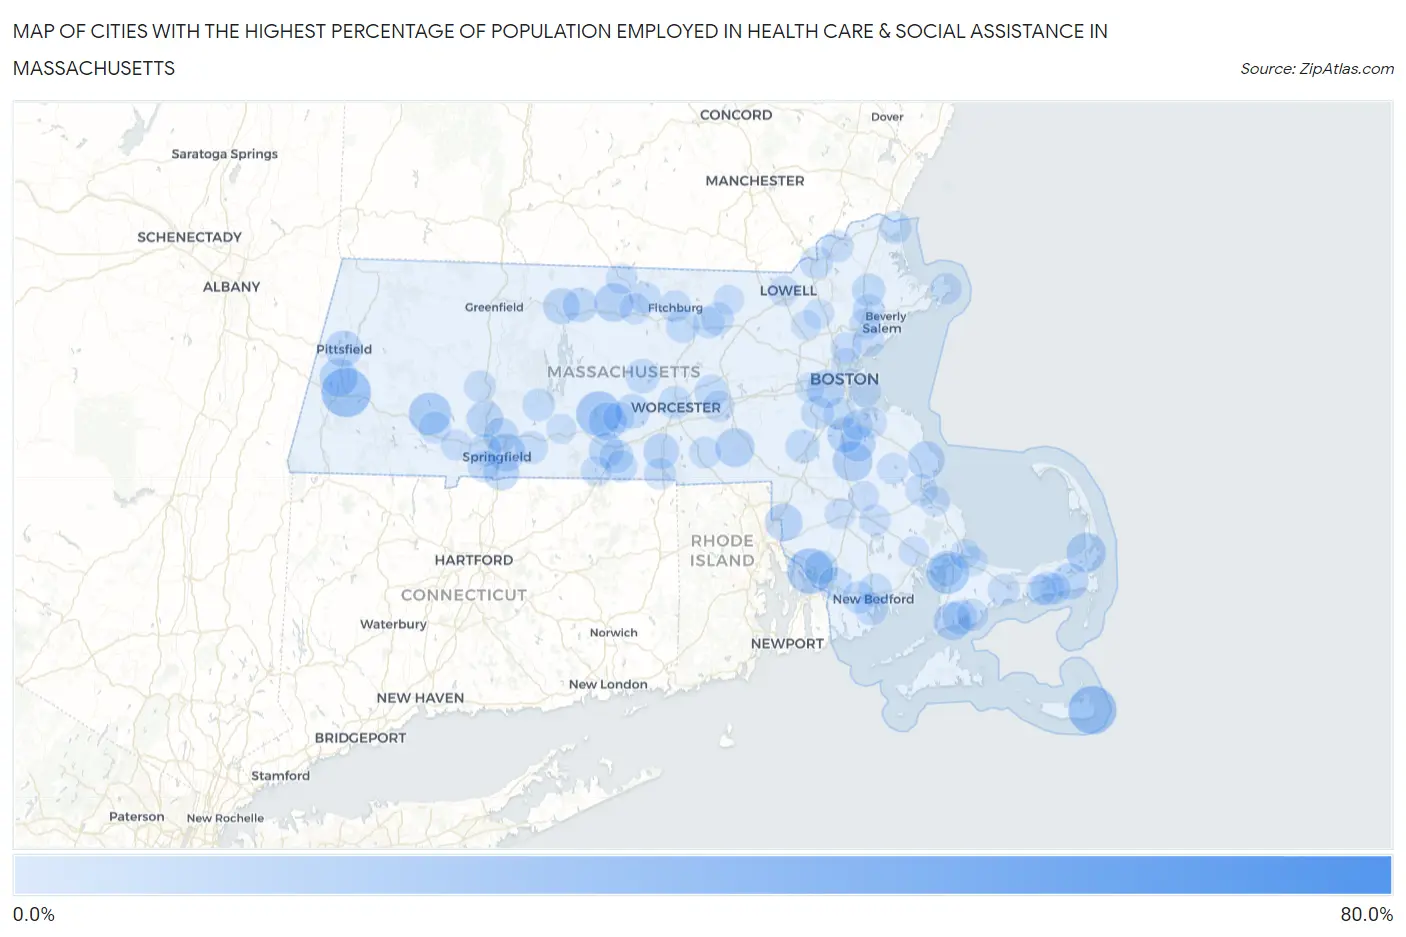
Map of Cities with the Highest Percentage of Population Employed in Health Care & Social Assistance in Massachusetts
0.0%
80.0%
Cities with the Highest Percentage of Population Employed in Health Care & Social Assistance in Massachusetts
| City | % Employed | vs State | vs National | |
| 1. | Lenox Dale | 76.1% | 16.1%(+60.0)#1 | 13.9%(+62.2)#94 |
| 2. | Lee | 35.7% | 16.1%(+19.5)#2 | 13.9%(+21.8)#822 |
| 3. | Siasconset | 34.6% | 16.1%(+18.5)#3 | 13.9%(+20.7)#910 |
| 4. | Oak Bluffs | 32.4% | 16.1%(+16.3)#4 | 13.9%(+18.5)#1,131 |
| 5. | Ocean Grove | 32.0% | 16.1%(+15.8)#5 | 13.9%(+18.0)#1,200 |
| 6. | West Brookfield | 31.4% | 16.1%(+15.3)#6 | 13.9%(+17.5)#1,279 |
| 7. | Monument Beach | 29.1% | 16.1%(+13.0)#7 | 13.9%(+15.2)#1,610 |
| 8. | Huntington | 28.5% | 16.1%(+12.4)#8 | 13.9%(+14.6)#1,743 |
| 9. | Brockton | 25.9% | 16.1%(+9.79)#9 | 13.9%(+12.0)#2,327 |
| 10. | Orleans | 25.7% | 16.1%(+9.54)#10 | 13.9%(+11.7)#2,392 |
| 11. | Hopedale | 25.3% | 16.1%(+9.11)#11 | 13.9%(+11.3)#2,515 |
| 12. | Baldwinville | 24.9% | 16.1%(+8.75)#12 | 13.9%(+11.0)#2,667 |
| 13. | Cedar Crest | 24.7% | 16.1%(+8.53)#13 | 13.9%(+10.7)#2,746 |
| 14. | Lenox | 24.2% | 16.1%(+8.10)#14 | 13.9%(+10.3)#2,891 |
| 15. | Brookline | 24.2% | 16.1%(+8.02)#15 | 13.9%(+10.2)#2,924 |
| 16. | Springfield | 24.1% | 16.1%(+7.93)#16 | 13.9%(+10.1)#2,959 |
| 17. | Teaticket | 24.0% | 16.1%(+7.85)#17 | 13.9%(+10.1)#2,989 |
| 18. | Brookfield | 24.0% | 16.1%(+7.85)#18 | 13.9%(+10.1)#2,993 |
| 19. | North Seekonk | 23.6% | 16.1%(+7.48)#19 | 13.9%(+9.68)#3,140 |
| 20. | Marshfield | 23.4% | 16.1%(+7.30)#20 | 13.9%(+9.51)#3,229 |
| 21. | Harwich Center | 22.8% | 16.1%(+6.65)#21 | 13.9%(+8.85)#3,542 |
| 22. | Pittsfield | 22.8% | 16.1%(+6.63)#22 | 13.9%(+8.84)#3,555 |
| 23. | Holyoke | 22.5% | 16.1%(+6.35)#23 | 13.9%(+8.55)#3,685 |
| 24. | Orange | 22.4% | 16.1%(+6.28)#24 | 13.9%(+8.49)#3,707 |
| 25. | Holbrook | 22.0% | 16.1%(+5.84)#25 | 13.9%(+8.05)#3,942 |
| 26. | Oxford | 21.9% | 16.1%(+5.73)#26 | 13.9%(+7.93)#4,014 |
| 27. | Longmeadow | 21.8% | 16.1%(+5.70)#27 | 13.9%(+7.90)#4,028 |
| 28. | Randolph Town | 21.6% | 16.1%(+5.44)#28 | 13.9%(+7.64)#4,215 |
| 29. | Fiskdale | 21.0% | 16.1%(+4.83)#29 | 13.9%(+7.04)#4,653 |
| 30. | Spencer | 20.9% | 16.1%(+4.79)#30 | 13.9%(+6.99)#4,680 |
| 31. | Athol | 20.9% | 16.1%(+4.71)#31 | 13.9%(+6.92)#4,741 |
| 32. | East Falmouth | 20.8% | 16.1%(+4.70)#32 | 13.9%(+6.90)#4,750 |
| 33. | Chicopee | 20.6% | 16.1%(+4.41)#33 | 13.9%(+6.62)#4,977 |
| 34. | Greenfield | 20.5% | 16.1%(+4.38)#34 | 13.9%(+6.59)#4,993 |
| 35. | Rutland | 20.4% | 16.1%(+4.29)#35 | 13.9%(+6.49)#5,068 |
| 36. | Walpole | 20.3% | 16.1%(+4.19)#36 | 13.9%(+6.39)#5,149 |
| 37. | West Dennis | 20.1% | 16.1%(+3.93)#37 | 13.9%(+6.13)#5,366 |
| 38. | Somerset | 19.9% | 16.1%(+3.73)#38 | 13.9%(+5.94)#5,563 |
| 39. | Sturbridge | 19.7% | 16.1%(+3.59)#39 | 13.9%(+5.79)#5,669 |
| 40. | Leominster | 19.6% | 16.1%(+3.43)#40 | 13.9%(+5.63)#5,808 |
| 41. | Topsfield | 19.5% | 16.1%(+3.35)#41 | 13.9%(+5.56)#5,872 |
| 42. | Worcester | 19.4% | 16.1%(+3.28)#42 | 13.9%(+5.48)#5,929 |
| 43. | Northborough | 19.3% | 16.1%(+3.20)#43 | 13.9%(+5.41)#6,017 |
| 44. | New Bedford | 19.3% | 16.1%(+3.17)#44 | 13.9%(+5.37)#6,046 |
| 45. | Milton | 19.3% | 16.1%(+3.16)#45 | 13.9%(+5.37)#6,052 |
| 46. | Dedham | 19.3% | 16.1%(+3.14)#46 | 13.9%(+5.34)#6,076 |
| 47. | Fall River | 19.2% | 16.1%(+3.07)#47 | 13.9%(+5.28)#6,137 |
| 48. | Wilbraham | 19.2% | 16.1%(+3.01)#48 | 13.9%(+5.22)#6,189 |
| 49. | Bliss Corner | 19.1% | 16.1%(+2.98)#49 | 13.9%(+5.19)#6,223 |
| 50. | Devens | 19.0% | 16.1%(+2.87)#50 | 13.9%(+5.07)#6,341 |
| 51. | Bourne | 19.0% | 16.1%(+2.83)#51 | 13.9%(+5.03)#6,386 |
| 52. | West Springfield Town | 18.9% | 16.1%(+2.81)#52 | 13.9%(+5.01)#6,407 |
| 53. | Salisbury | 18.9% | 16.1%(+2.80)#53 | 13.9%(+5.00)#6,411 |
| 54. | Methuen Town | 18.8% | 16.1%(+2.67)#54 | 13.9%(+4.87)#6,533 |
| 55. | Belchertown | 18.7% | 16.1%(+2.53)#55 | 13.9%(+4.74)#6,673 |
| 56. | Smith Mills | 18.6% | 16.1%(+2.46)#56 | 13.9%(+4.66)#6,756 |
| 57. | Kingston | 18.4% | 16.1%(+2.29)#57 | 13.9%(+4.50)#6,930 |
| 58. | Boston | 18.4% | 16.1%(+2.27)#58 | 13.9%(+4.48)#6,954 |
| 59. | Haverhill | 18.4% | 16.1%(+2.24)#59 | 13.9%(+4.45)#6,978 |
| 60. | Russell | 18.4% | 16.1%(+2.23)#60 | 13.9%(+4.44)#6,987 |
| 61. | Southbridge Town | 18.4% | 16.1%(+2.23)#61 | 13.9%(+4.44)#6,988 |
| 62. | Fitchburg | 18.3% | 16.1%(+2.20)#62 | 13.9%(+4.40)#7,031 |
| 63. | Shirley | 18.2% | 16.1%(+2.10)#63 | 13.9%(+4.30)#7,144 |
| 64. | Barnstable Town | 18.2% | 16.1%(+2.02)#64 | 13.9%(+4.22)#7,261 |
| 65. | Seabrook | 18.0% | 16.1%(+1.89)#65 | 13.9%(+4.10)#7,403 |
| 66. | Webster | 18.0% | 16.1%(+1.89)#66 | 13.9%(+4.09)#7,412 |
| 67. | Whitinsville | 18.0% | 16.1%(+1.88)#67 | 13.9%(+4.08)#7,425 |
| 68. | Danvers | 18.0% | 16.1%(+1.84)#68 | 13.9%(+4.04)#7,469 |
| 69. | Agawam Town | 17.9% | 16.1%(+1.78)#69 | 13.9%(+3.99)#7,548 |
| 70. | Northampton | 17.8% | 16.1%(+1.68)#70 | 13.9%(+3.88)#7,667 |
| 71. | Westborough | 17.8% | 16.1%(+1.67)#71 | 13.9%(+3.87)#7,677 |
| 72. | South Ashburnham | 17.7% | 16.1%(+1.53)#72 | 13.9%(+3.73)#7,858 |
| 73. | Rockport | 17.6% | 16.1%(+1.43)#73 | 13.9%(+3.63)#8,014 |
| 74. | Peabody | 17.5% | 16.1%(+1.35)#74 | 13.9%(+3.55)#8,113 |
| 75. | Lynn | 17.5% | 16.1%(+1.32)#75 | 13.9%(+3.53)#8,141 |
| 76. | East Brookfield | 17.4% | 16.1%(+1.29)#76 | 13.9%(+3.50)#8,182 |
| 77. | Gardner | 17.4% | 16.1%(+1.28)#77 | 13.9%(+3.49)#8,198 |
| 78. | Middleborough Center | 17.4% | 16.1%(+1.27)#78 | 13.9%(+3.47)#8,218 |
| 79. | Weymouth Town | 17.4% | 16.1%(+1.26)#79 | 13.9%(+3.46)#8,225 |
| 80. | Hanson | 17.4% | 16.1%(+1.23)#80 | 13.9%(+3.43)#8,271 |
| 81. | Dennis Port | 17.3% | 16.1%(+1.21)#81 | 13.9%(+3.41)#8,293 |
| 82. | Winchendon | 17.3% | 16.1%(+1.19)#82 | 13.9%(+3.40)#8,315 |
| 83. | Westfield | 17.2% | 16.1%(+1.05)#83 | 13.9%(+3.26)#8,507 |
| 84. | South Yarmouth | 17.1% | 16.1%(+0.956)#84 | 13.9%(+3.16)#8,634 |
| 85. | Taunton | 17.1% | 16.1%(+0.914)#85 | 13.9%(+3.12)#8,698 |
| 86. | Lowell | 16.9% | 16.1%(+0.725)#86 | 13.9%(+2.93)#8,934 |
| 87. | Melrose | 16.8% | 16.1%(+0.666)#87 | 13.9%(+2.87)#9,011 |
| 88. | Holland | 16.7% | 16.1%(+0.569)#88 | 13.9%(+2.77)#9,146 |
| 89. | West Wareham | 16.7% | 16.1%(+0.527)#89 | 13.9%(+2.73)#9,191 |
| 90. | Bridgewater Town | 16.7% | 16.1%(+0.522)#90 | 13.9%(+2.73)#9,286 |
| 91. | Groton | 16.6% | 16.1%(+0.439)#91 | 13.9%(+2.64)#9,360 |
| 92. | Braintree Town | 16.5% | 16.1%(+0.365)#92 | 13.9%(+2.57)#9,457 |
| 93. | Wilmington | 16.4% | 16.1%(+0.217)#93 | 13.9%(+2.42)#9,662 |
| 94. | Sandwich | 16.3% | 16.1%(+0.115)#94 | 13.9%(+2.32)#9,809 |
| 95. | Pinehurst | 16.2% | 16.1%(+0.072)#95 | 13.9%(+2.28)#9,886 |
| 96. | Palmer Town | 16.2% | 16.1%(+0.064)#96 | 13.9%(+2.27)#9,895 |
| 97. | Sagamore | 16.1% | 16.1%(+0.003)#97 | 13.9%(+2.21)#9,977 |
| 98. | Plymouth | 16.1% | 16.1%(-0.077)#98 | 13.9%(+2.13)#10,109 |
| 99. | Newton | 16.0% | 16.1%(-0.124)#99 | 13.9%(+2.08)#10,186 |
| 100. | Everett | 16.0% | 16.1%(-0.173)#100 | 13.9%(+2.03)#10,257 |
Common Questions
What are the Top 10 Cities with the Highest Percentage of Population Employed in Health Care & Social Assistance in Massachusetts?
Top 10 Cities with the Highest Percentage of Population Employed in Health Care & Social Assistance in Massachusetts are:
#1
35.7%
#2
34.6%
#3
32.0%
#4
31.4%
#5
29.1%
#6
28.5%
#7
25.9%
#8
25.7%
#9
25.3%
#10
24.9%
What city has the Highest Percentage of Population Employed in Health Care & Social Assistance in Massachusetts?
Lee has the Highest Percentage of Population Employed in Health Care & Social Assistance in Massachusetts with 35.7%.
What is the Percentage of Population Employed in Health Care & Social Assistance in the State of Massachusetts?
Percentage of Population Employed in Health Care & Social Assistance in Massachusetts is 16.1%.
What is the Percentage of Population Employed in Health Care & Social Assistance in the United States?
Percentage of Population Employed in Health Care & Social Assistance in the United States is 13.9%.