Cities with the Highest Percentage of Population Employed in Health Care & Social Assistance in New Mexico
RELATED REPORTS & OPTIONS
Health Care & Social Assistance
New Mexico
Compare Cities
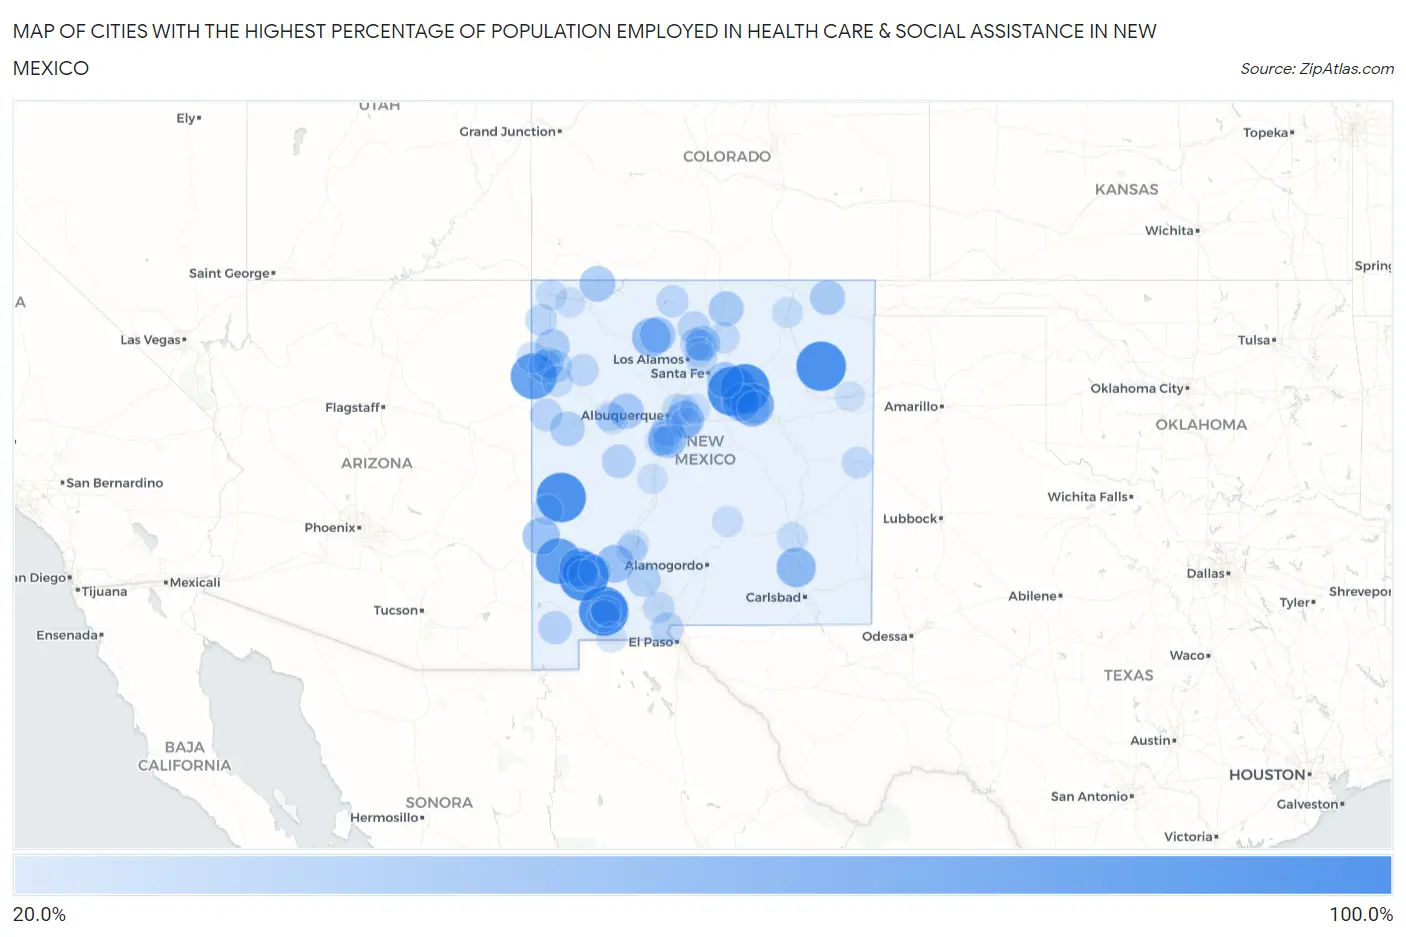
Map of Cities with the Highest Percentage of Population Employed in Health Care & Social Assistance in New Mexico
0.0%
100.0%
Cities with the Highest Percentage of Population Employed in Health Care & Social Assistance in New Mexico
| City | % Employed | vs State | vs National | |
| 1. | Soham | 100.0% | 14.8%(+85.2)#1 | 13.9%(+86.1)#10 |
| 2. | Medanales | 100.0% | 14.8%(+85.2)#2 | 13.9%(+86.1)#14 |
| 3. | Aragon | 100.0% | 14.8%(+85.2)#3 | 13.9%(+86.1)#17 |
| 4. | Pulpotio Bareas | 100.0% | 14.8%(+85.2)#4 | 13.9%(+86.1)#27 |
| 5. | North Hurley | 100.0% | 14.8%(+85.2)#5 | 13.9%(+86.1)#28 |
| 6. | Encantado | 100.0% | 14.8%(+85.2)#6 | 13.9%(+86.1)#31 |
| 7. | Seton | 100.0% | 14.8%(+85.2)#7 | 13.9%(+86.1)#49 |
| 8. | Mosquero | 100.0% | 14.8%(+85.2)#8 | 13.9%(+86.1)#55 |
| 9. | Tecolote | 100.0% | 14.8%(+85.2)#9 | 13.9%(+86.1)#56 |
| 10. | Tse Bonito | 85.7% | 14.8%(+70.9)#10 | 13.9%(+71.8)#83 |
| 11. | Gila | 84.0% | 14.8%(+69.2)#11 | 13.9%(+70.1)#84 |
| 12. | Tecolotito | 72.4% | 14.8%(+57.6)#12 | 13.9%(+58.5)#107 |
| 13. | Fort Wingate | 61.7% | 14.8%(+46.9)#13 | 13.9%(+47.8)#172 |
| 14. | Canones | 60.3% | 14.8%(+45.5)#14 | 13.9%(+46.4)#180 |
| 15. | Rio Chiquito | 58.9% | 14.8%(+44.1)#15 | 13.9%(+45.0)#195 |
| 16. | Morningside | 57.9% | 14.8%(+43.1)#16 | 13.9%(+44.0)#203 |
| 17. | Timberlake | 56.2% | 14.8%(+41.4)#17 | 13.9%(+42.3)#220 |
| 18. | Pinos Altos | 55.6% | 14.8%(+40.7)#18 | 13.9%(+41.6)#229 |
| 19. | Regina | 55.0% | 14.8%(+40.2)#19 | 13.9%(+41.1)#240 |
| 20. | Monterey Park | 54.9% | 14.8%(+40.1)#20 | 13.9%(+41.0)#241 |
| 21. | Sagar | 54.8% | 14.8%(+40.0)#21 | 13.9%(+40.9)#243 |
| 22. | Williams Acres | 53.8% | 14.8%(+39.0)#22 | 13.9%(+39.9)#259 |
| 23. | Cedro | 53.2% | 14.8%(+38.4)#23 | 13.9%(+39.3)#272 |
| 24. | Butterfield Park | 51.7% | 14.8%(+36.9)#24 | 13.9%(+37.8)#294 |
| 25. | Hillsboro | 51.1% | 14.8%(+36.3)#25 | 13.9%(+37.2)#308 |
| 26. | Villanueva | 50.9% | 14.8%(+36.0)#26 | 13.9%(+36.9)#316 |
| 27. | Glenwood | 50.0% | 14.8%(+35.2)#27 | 13.9%(+36.1)#332 |
| 28. | Ventura | 49.0% | 14.8%(+34.1)#28 | 13.9%(+35.0)#362 |
| 29. | Gallina | 45.7% | 14.8%(+30.8)#29 | 13.9%(+31.7)#431 |
| 30. | East Pecos | 44.5% | 14.8%(+29.7)#30 | 13.9%(+30.6)#453 |
| 31. | Cedar Hill | 43.4% | 14.8%(+28.6)#31 | 13.9%(+29.5)#485 |
| 32. | La Villita | 42.6% | 14.8%(+27.8)#32 | 13.9%(+28.7)#511 |
| 33. | Arenas Valley | 42.2% | 14.8%(+27.4)#33 | 13.9%(+28.3)#524 |
| 34. | Paguate | 41.8% | 14.8%(+27.0)#34 | 13.9%(+27.9)#528 |
| 35. | Des Moines | 41.7% | 14.8%(+26.8)#35 | 13.9%(+27.7)#532 |
| 36. | San Cristobal | 40.5% | 14.8%(+25.6)#36 | 13.9%(+26.5)#570 |
| 37. | Lybrook | 39.1% | 14.8%(+24.3)#37 | 13.9%(+25.2)#627 |
| 38. | Pinehill | 39.0% | 14.8%(+24.2)#38 | 13.9%(+25.1)#635 |
| 39. | Borrego Pass | 38.9% | 14.8%(+24.1)#39 | 13.9%(+25.0)#642 |
| 40. | Naschitti | 38.6% | 14.8%(+23.8)#40 | 13.9%(+24.7)#657 |
| 41. | Sunlit Hills | 38.3% | 14.8%(+23.5)#41 | 13.9%(+24.4)#673 |
| 42. | Tortugas | 36.7% | 14.8%(+21.8)#42 | 13.9%(+22.7)#752 |
| 43. | Rincon | 35.8% | 14.8%(+20.9)#43 | 13.9%(+21.8)#813 |
| 44. | Crestview | 35.7% | 14.8%(+20.9)#44 | 13.9%(+21.8)#817 |
| 45. | Manuelito | 35.7% | 14.8%(+20.9)#45 | 13.9%(+21.8)#819 |
| 46. | Little Walnut | 35.0% | 14.8%(+20.1)#46 | 13.9%(+21.0)#881 |
| 47. | Alamo | 34.9% | 14.8%(+20.1)#47 | 13.9%(+21.0)#883 |
| 48. | Windmill | 34.8% | 14.8%(+19.9)#48 | 13.9%(+20.8)#894 |
| 49. | Brimhall Nizhoni | 34.5% | 14.8%(+19.7)#49 | 13.9%(+20.6)#916 |
| 50. | Nakaibito | 33.8% | 14.8%(+19.0)#50 | 13.9%(+19.9)#978 |
| 51. | Torreon Cdp Sandoval County | 33.8% | 14.8%(+18.9)#51 | 13.9%(+19.8)#981 |
| 52. | Anton Chico | 33.3% | 14.8%(+18.5)#52 | 13.9%(+19.4)#1,018 |
| 53. | San Lorenzo | 32.5% | 14.8%(+17.7)#53 | 13.9%(+18.6)#1,120 |
| 54. | Haystack | 32.5% | 14.8%(+17.7)#54 | 13.9%(+18.6)#1,123 |
| 55. | La Union | 32.4% | 14.8%(+17.6)#55 | 13.9%(+18.5)#1,127 |
| 56. | Black Rock | 32.1% | 14.8%(+17.3)#56 | 13.9%(+18.2)#1,174 |
| 57. | Chical | 31.9% | 14.8%(+17.1)#57 | 13.9%(+18.0)#1,204 |
| 58. | Sunshine | 31.4% | 14.8%(+16.5)#58 | 13.9%(+17.4)#1,285 |
| 59. | El Rito | 31.3% | 14.8%(+16.5)#59 | 13.9%(+17.4)#1,296 |
| 60. | Chili | 30.6% | 14.8%(+15.7)#60 | 13.9%(+16.6)#1,380 |
| 61. | Tierra Amarilla | 29.9% | 14.8%(+15.1)#61 | 13.9%(+16.0)#1,491 |
| 62. | Crownpoint | 29.6% | 14.8%(+14.7)#62 | 13.9%(+15.6)#1,537 |
| 63. | Picacho Hills | 29.6% | 14.8%(+14.7)#63 | 13.9%(+15.6)#1,538 |
| 64. | Sanostee | 28.8% | 14.8%(+14.0)#64 | 13.9%(+14.9)#1,669 |
| 65. | Jaconita | 28.4% | 14.8%(+13.6)#65 | 13.9%(+14.5)#1,754 |
| 66. | Torreon Cdp Torrance County | 28.4% | 14.8%(+13.6)#66 | 13.9%(+14.5)#1,755 |
| 67. | Mesilla | 28.4% | 14.8%(+13.6)#67 | 13.9%(+14.5)#1,758 |
| 68. | Vadito | 28.4% | 14.8%(+13.5)#68 | 13.9%(+14.4)#1,767 |
| 69. | Alcalde | 27.8% | 14.8%(+12.9)#69 | 13.9%(+13.8)#1,874 |
| 70. | Navajo | 27.6% | 14.8%(+12.7)#70 | 13.9%(+13.7)#1,916 |
| 71. | Cannon Afb | 27.5% | 14.8%(+12.6)#71 | 13.9%(+13.5)#1,946 |
| 72. | Tohatchi | 26.9% | 14.8%(+12.1)#72 | 13.9%(+13.0)#2,060 |
| 73. | Skyline Ganipa | 26.0% | 14.8%(+11.2)#73 | 13.9%(+12.1)#2,304 |
| 74. | Williamsburg | 25.8% | 14.8%(+10.9)#74 | 13.9%(+11.8)#2,368 |
| 75. | Bayard | 25.7% | 14.8%(+10.9)#75 | 13.9%(+11.8)#2,379 |
| 76. | Church Rock | 25.6% | 14.8%(+10.7)#76 | 13.9%(+11.6)#2,424 |
| 77. | Golden Acres | 25.5% | 14.8%(+10.7)#77 | 13.9%(+11.6)#2,437 |
| 78. | Maxwell | 25.2% | 14.8%(+10.4)#78 | 13.9%(+11.3)#2,528 |
| 79. | Sandia Heights | 25.1% | 14.8%(+10.2)#79 | 13.9%(+11.1)#2,571 |
| 80. | Midway | 25.0% | 14.8%(+10.2)#80 | 13.9%(+11.1)#2,585 |
| 81. | Shiprock | 24.9% | 14.8%(+10.1)#81 | 13.9%(+11.0)#2,653 |
| 82. | Capitan | 24.7% | 14.8%(+9.84)#82 | 13.9%(+10.7)#2,744 |
| 83. | Sandia Park | 24.2% | 14.8%(+9.41)#83 | 13.9%(+10.3)#2,887 |
| 84. | Truth Or Consequences | 24.2% | 14.8%(+9.33)#84 | 13.9%(+10.2)#2,919 |
| 85. | Reserve | 24.1% | 14.8%(+9.24)#85 | 13.9%(+10.1)#2,956 |
| 86. | Ponderosa Pine | 24.0% | 14.8%(+9.19)#86 | 13.9%(+10.1)#2,971 |
| 87. | Cedar Grove | 23.6% | 14.8%(+8.74)#87 | 13.9%(+9.64)#3,159 |
| 88. | Isleta | 23.5% | 14.8%(+8.64)#88 | 13.9%(+9.54)#3,215 |
| 89. | Belen | 23.3% | 14.8%(+8.46)#89 | 13.9%(+9.36)#3,302 |
| 90. | Mccartys Village | 23.2% | 14.8%(+8.40)#90 | 13.9%(+9.30)#3,327 |
| 91. | Santa Fe Foothills | 23.1% | 14.8%(+8.31)#91 | 13.9%(+9.21)#3,363 |
| 92. | Ojo Amarillo | 23.1% | 14.8%(+8.31)#92 | 13.9%(+9.21)#3,364 |
| 93. | Lemitar | 22.9% | 14.8%(+8.06)#93 | 13.9%(+8.97)#3,498 |
| 94. | Columbus | 22.7% | 14.8%(+7.90)#94 | 13.9%(+8.80)#3,570 |
| 95. | Adelino | 22.4% | 14.8%(+7.61)#95 | 13.9%(+8.51)#3,696 |
| 96. | Hyde Park | 22.3% | 14.8%(+7.48)#96 | 13.9%(+8.38)#3,766 |
| 97. | Logan | 21.8% | 14.8%(+6.99)#97 | 13.9%(+7.90)#4,033 |
| 98. | La Hacienda | 21.8% | 14.8%(+6.97)#98 | 13.9%(+7.87)#4,053 |
| 99. | Las Maravillas | 21.8% | 14.8%(+6.95)#99 | 13.9%(+7.85)#4,067 |
| 100. | Santa Clara Pueblo | 21.4% | 14.8%(+6.59)#100 | 13.9%(+7.49)#4,294 |
Common Questions
What are the Top 10 Cities with the Highest Percentage of Population Employed in Health Care & Social Assistance in New Mexico?
Top 10 Cities with the Highest Percentage of Population Employed in Health Care & Social Assistance in New Mexico are:
#1
100.0%
#2
100.0%
#3
100.0%
#4
100.0%
#5
100.0%
#6
100.0%
#7
85.7%
#8
84.0%
#9
72.4%
#10
57.9%
What city has the Highest Percentage of Population Employed in Health Care & Social Assistance in New Mexico?
Soham has the Highest Percentage of Population Employed in Health Care & Social Assistance in New Mexico with 100.0%.
What is the Percentage of Population Employed in Health Care & Social Assistance in the State of New Mexico?
Percentage of Population Employed in Health Care & Social Assistance in New Mexico is 14.8%.
What is the Percentage of Population Employed in Health Care & Social Assistance in the United States?
Percentage of Population Employed in Health Care & Social Assistance in the United States is 13.9%.