Zip Codes with the Highest Percentage of Population Employed in Health Care & Social Assistance in Los Angeles, CA
RELATED REPORTS & OPTIONS
Health Care & Social Assistance
Los Angeles
Compare Zip Codes
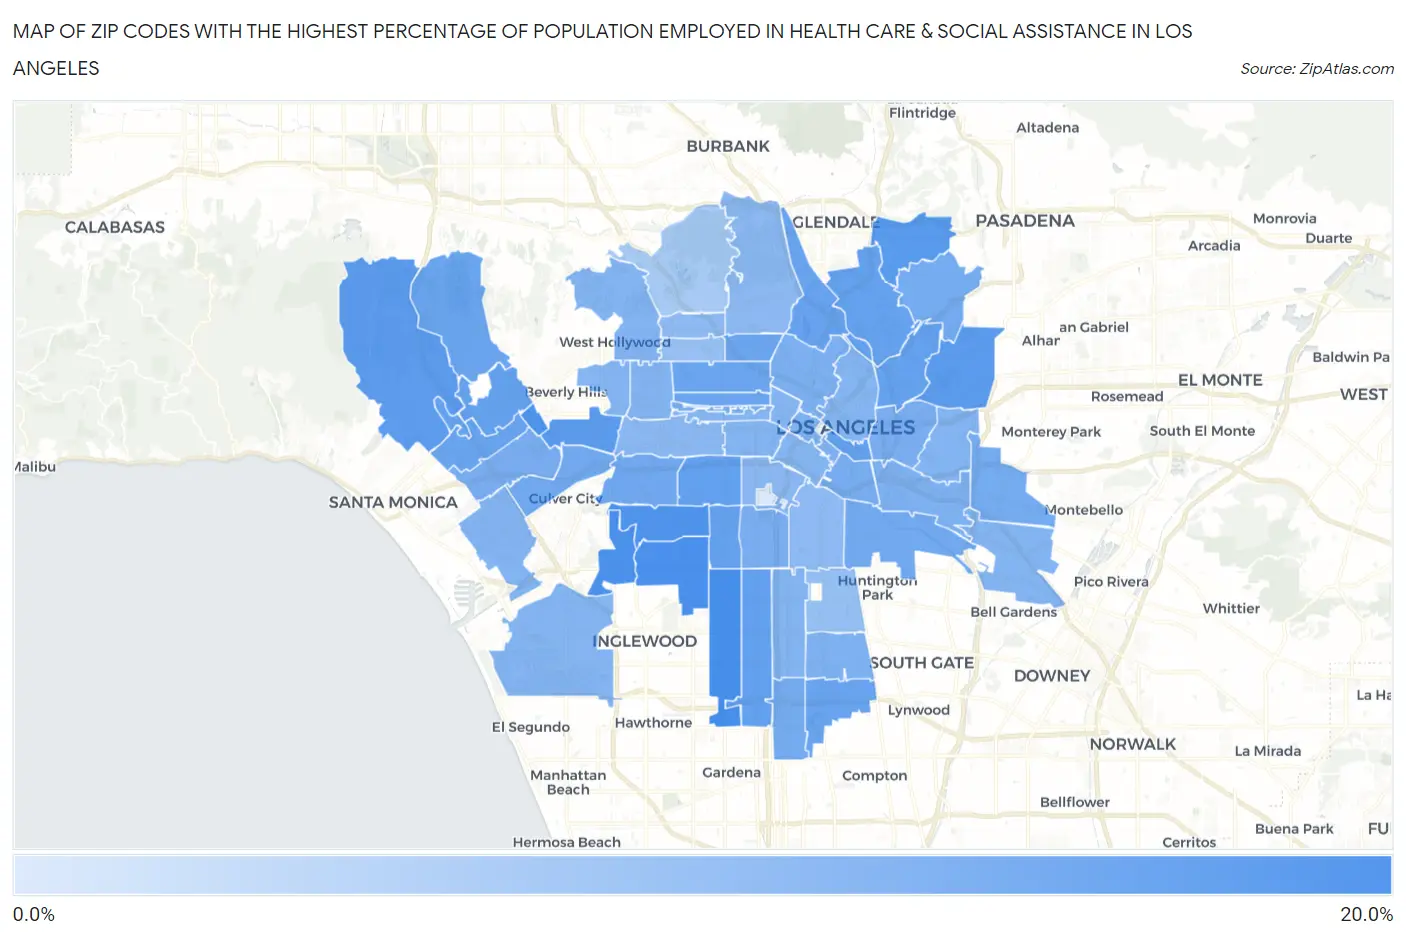
Map of Zip Codes with the Highest Percentage of Population Employed in Health Care & Social Assistance in Los Angeles
1.4%
16.2%
Zip Codes with the Highest Percentage of Population Employed in Health Care & Social Assistance in Los Angeles, CA
| Zip Code | % Employed | vs State | vs National | |
| 1. | 90047 | 16.2% | 12.7%(+3.49)#258 | 13.9%(+2.29)#9,082 |
| 2. | 90043 | 15.9% | 12.7%(+3.14)#291 | 13.9%(+1.95)#9,742 |
| 3. | 90056 | 15.7% | 12.7%(+2.92)#308 | 13.9%(+1.72)#10,183 |
| 4. | 90067 | 15.5% | 12.7%(+2.75)#325 | 13.9%(+1.55)#10,534 |
| 5. | 90008 | 15.3% | 12.7%(+2.57)#341 | 13.9%(+1.37)#10,964 |
| 6. | 90041 | 14.5% | 12.7%(+1.78)#431 | 13.9%(+0.584)#12,787 |
| 7. | 90032 | 14.0% | 12.7%(+1.22)#500 | 13.9%(+0.022)#14,157 |
| 8. | 90035 | 13.9% | 12.7%(+1.19)#503 | 13.9%(-0.003)#14,227 |
| 9. | 90049 | 13.7% | 12.7%(+0.994)#543 | 13.9%(-0.203)#14,714 |
| 10. | 90044 | 13.4% | 12.7%(+0.681)#585 | 13.9%(-0.517)#15,497 |
| 11. | 90018 | 13.4% | 12.7%(+0.659)#589 | 13.9%(-0.539)#15,564 |
| 12. | 90013 | 13.3% | 12.7%(+0.565)#601 | 13.9%(-0.632)#15,783 |
| 13. | 90031 | 13.2% | 12.7%(+0.466)#611 | 13.9%(-0.731)#16,044 |
| 14. | 90065 | 13.1% | 12.7%(+0.359)#641 | 13.9%(-0.838)#16,336 |
| 15. | 90073 | 13.1% | 12.7%(+0.357)#642 | 13.9%(-0.840)#16,346 |
| 16. | 90024 | 13.1% | 12.7%(+0.340)#647 | 13.9%(-0.858)#16,390 |
| 17. | 90062 | 13.0% | 12.7%(+0.274)#656 | 13.9%(-0.923)#16,552 |
| 18. | 90039 | 12.8% | 12.7%(+0.095)#690 | 13.9%(-1.10)#17,003 |
| 19. | 90059 | 12.7% | 12.7%(-0.083)#727 | 13.9%(-1.28)#17,478 |
| 20. | 90025 | 12.6% | 12.7%(-0.175)#739 | 13.9%(-1.37)#17,677 |
| 21. | 90020 | 12.5% | 12.7%(-0.245)#754 | 13.9%(-1.44)#17,877 |
| 22. | 90004 | 12.3% | 12.7%(-0.389)#783 | 13.9%(-1.59)#18,227 |
| 23. | 90029 | 12.3% | 12.7%(-0.399)#785 | 13.9%(-1.60)#18,244 |
| 24. | 90077 | 12.3% | 12.7%(-0.401)#786 | 13.9%(-1.60)#18,255 |
| 25. | 90016 | 12.0% | 12.7%(-0.770)#856 | 13.9%(-1.97)#19,081 |
| 26. | 90034 | 11.8% | 12.7%(-0.981)#900 | 13.9%(-2.18)#19,585 |
| 27. | 90058 | 11.8% | 12.7%(-0.985)#903 | 13.9%(-2.18)#19,592 |
| 28. | 90042 | 11.5% | 12.7%(-1.24)#944 | 13.9%(-2.43)#20,207 |
| 29. | 90022 | 11.4% | 12.7%(-1.37)#974 | 13.9%(-2.57)#20,519 |
| 30. | 90061 | 11.3% | 12.7%(-1.39)#980 | 13.9%(-2.59)#20,570 |
| 31. | 90010 | 11.3% | 12.7%(-1.42)#990 | 13.9%(-2.62)#20,639 |
| 32. | 90021 | 11.2% | 12.7%(-1.59)#1,015 | 13.9%(-2.78)#21,013 |
| 33. | 90037 | 11.0% | 12.7%(-1.71)#1,028 | 13.9%(-2.90)#21,275 |
| 34. | 90033 | 10.9% | 12.7%(-1.80)#1,043 | 13.9%(-3.00)#21,482 |
| 35. | 90064 | 10.9% | 12.7%(-1.82)#1,047 | 13.9%(-3.02)#21,522 |
| 36. | 90026 | 10.8% | 12.7%(-1.89)#1,056 | 13.9%(-3.09)#21,683 |
| 37. | 90002 | 10.6% | 12.7%(-2.13)#1,093 | 13.9%(-3.33)#22,211 |
| 38. | 90017 | 10.6% | 12.7%(-2.16)#1,096 | 13.9%(-3.36)#22,282 |
| 39. | 90023 | 10.5% | 12.7%(-2.25)#1,107 | 13.9%(-3.44)#22,457 |
| 40. | 90014 | 10.4% | 12.7%(-2.32)#1,126 | 13.9%(-3.52)#22,624 |
| 41. | 90066 | 10.2% | 12.7%(-2.58)#1,159 | 13.9%(-3.78)#23,121 |
| 42. | 90046 | 10.1% | 12.7%(-2.62)#1,164 | 13.9%(-3.82)#23,180 |
| 43. | 90003 | 10.1% | 12.7%(-2.65)#1,167 | 13.9%(-3.85)#23,232 |
| 44. | 90006 | 10.1% | 12.7%(-2.68)#1,171 | 13.9%(-3.87)#23,293 |
| 45. | 90040 | 10.0% | 12.7%(-2.69)#1,175 | 13.9%(-3.89)#23,330 |
| 46. | 90036 | 10.0% | 12.7%(-2.73)#1,180 | 13.9%(-3.92)#23,389 |
| 47. | 90063 | 9.9% | 12.7%(-2.80)#1,187 | 13.9%(-4.00)#23,542 |
| 48. | 90005 | 9.9% | 12.7%(-2.81)#1,190 | 13.9%(-4.01)#23,582 |
| 49. | 90048 | 9.9% | 12.7%(-2.83)#1,192 | 13.9%(-4.03)#23,616 |
| 50. | 90012 | 9.9% | 12.7%(-2.85)#1,194 | 13.9%(-4.04)#23,640 |
| 51. | 90057 | 9.8% | 12.7%(-2.95)#1,203 | 13.9%(-4.15)#23,846 |
| 52. | 90045 | 9.8% | 12.7%(-2.96)#1,204 | 13.9%(-4.16)#23,862 |
| 53. | 90015 | 9.8% | 12.7%(-2.98)#1,207 | 13.9%(-4.18)#23,920 |
| 54. | 90019 | 9.5% | 12.7%(-3.28)#1,240 | 13.9%(-4.47)#24,430 |
| 55. | 90007 | 9.4% | 12.7%(-3.34)#1,247 | 13.9%(-4.54)#24,551 |
| 56. | 90027 | 9.1% | 12.7%(-3.65)#1,282 | 13.9%(-4.84)#25,024 |
| 57. | 90011 | 9.0% | 12.7%(-3.74)#1,289 | 13.9%(-4.94)#25,172 |
| 58. | 90028 | 8.9% | 12.7%(-3.81)#1,295 | 13.9%(-5.00)#25,266 |
| 59. | 90001 | 8.2% | 12.7%(-4.56)#1,348 | 13.9%(-5.75)#26,280 |
| 60. | 90038 | 8.1% | 12.7%(-4.66)#1,355 | 13.9%(-5.85)#26,397 |
| 61. | 90068 | 6.5% | 12.7%(-6.26)#1,429 | 13.9%(-7.46)#27,969 |
| 62. | 90089 | 1.4% | 12.7%(-11.3)#1,571 | 13.9%(-12.5)#30,453 |
1
Common Questions
What are the Top 10 Zip Codes with the Highest Percentage of Population Employed in Health Care & Social Assistance in Los Angeles, CA?
Top 10 Zip Codes with the Highest Percentage of Population Employed in Health Care & Social Assistance in Los Angeles, CA are:
What zip code has the Highest Percentage of Population Employed in Health Care & Social Assistance in Los Angeles, CA?
90047 has the Highest Percentage of Population Employed in Health Care & Social Assistance in Los Angeles, CA with 16.2%.
What is the Percentage of Population Employed in Health Care & Social Assistance in Los Angeles, CA?
Percentage of Population Employed in Health Care & Social Assistance in Los Angeles is 12.2%.
What is the Percentage of Population Employed in Health Care & Social Assistance in California?
Percentage of Population Employed in Health Care & Social Assistance in California is 12.7%.
What is the Percentage of Population Employed in Health Care & Social Assistance in the United States?
Percentage of Population Employed in Health Care & Social Assistance in the United States is 13.9%.