Cities with the Highest Percentage of Population Employed in Health Care & Social Assistance in North Carolina
RELATED REPORTS & OPTIONS
Health Care & Social Assistance
North Carolina
Compare Cities
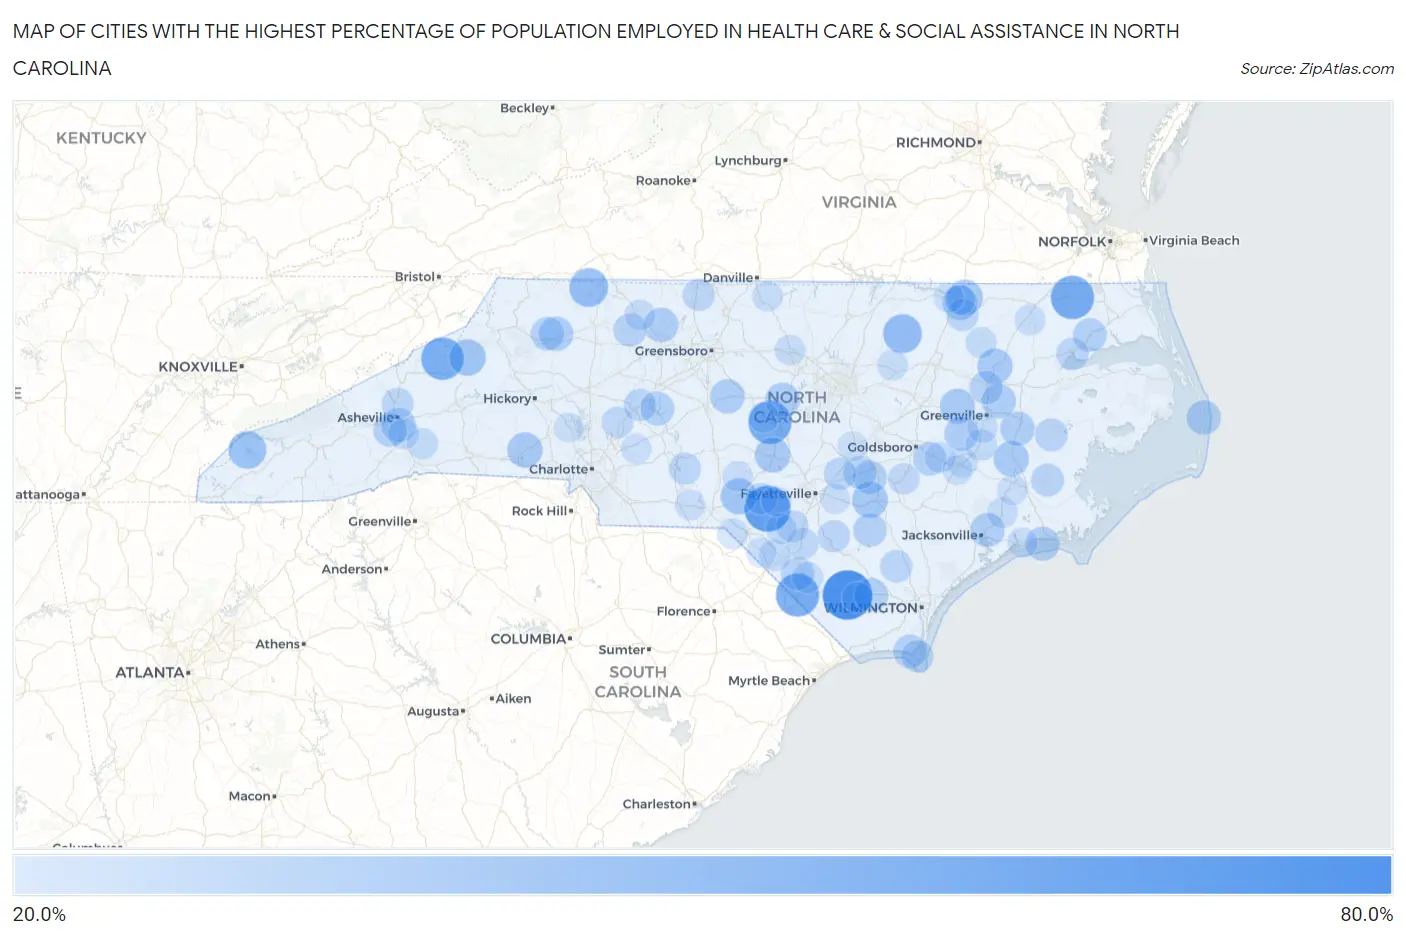
Map of Cities with the Highest Percentage of Population Employed in Health Care & Social Assistance in North Carolina
0.0%
80.0%
Cities with the Highest Percentage of Population Employed in Health Care & Social Assistance in North Carolina
| City | % Employed | vs State | vs National | |
| 1. | Hallsboro | 71.4% | 13.6%(+57.8)#1 | 13.9%(+57.5)#109 |
| 2. | Bowmore | 62.0% | 13.6%(+48.4)#2 | 13.9%(+48.1)#169 |
| 3. | Sunbury | 54.8% | 13.6%(+41.2)#3 | 13.9%(+40.9)#242 |
| 4. | Gulf | 54.7% | 13.6%(+41.1)#4 | 13.9%(+40.8)#245 |
| 5. | Fair Bluff | 54.5% | 13.6%(+40.9)#5 | 13.9%(+40.6)#247 |
| 6. | Barnardsville | 53.0% | 13.6%(+39.4)#6 | 13.9%(+39.1)#277 |
| 7. | Bakersville | 52.7% | 13.6%(+39.0)#7 | 13.9%(+38.7)#280 |
| 8. | Jackson Springs | 48.8% | 13.6%(+35.1)#8 | 13.9%(+34.8)#366 |
| 9. | Chowan Beach | 46.9% | 13.6%(+33.3)#9 | 13.9%(+32.9)#396 |
| 10. | Lowgap | 42.9% | 13.6%(+29.2)#10 | 13.9%(+28.9)#497 |
| 11. | Centerville | 42.7% | 13.6%(+29.1)#11 | 13.9%(+28.8)#508 |
| 12. | Lake Santeetlah | 40.0% | 13.6%(+26.4)#12 | 13.9%(+26.1)#592 |
| 13. | Crossnore | 37.0% | 13.6%(+23.4)#13 | 13.9%(+23.1)#732 |
| 14. | Hoffman | 36.3% | 13.6%(+22.6)#14 | 13.9%(+22.3)#787 |
| 15. | Bonnetsville | 35.7% | 13.6%(+22.1)#15 | 13.9%(+21.8)#815 |
| 16. | Garysburg | 35.6% | 13.6%(+21.9)#16 | 13.9%(+21.6)#831 |
| 17. | Cape Colony | 34.9% | 13.6%(+21.2)#17 | 13.9%(+20.9)#887 |
| 18. | Cameron | 34.5% | 13.6%(+20.9)#18 | 13.9%(+20.6)#918 |
| 19. | Glenwood | 34.5% | 13.6%(+20.9)#19 | 13.9%(+20.5)#919 |
| 20. | Waco | 34.3% | 13.6%(+20.7)#20 | 13.9%(+20.4)#936 |
| 21. | Oak City | 34.2% | 13.6%(+20.6)#21 | 13.9%(+20.2)#947 |
| 22. | Vanceboro | 34.0% | 13.6%(+20.4)#22 | 13.9%(+20.1)#957 |
| 23. | South Weldon | 33.6% | 13.6%(+19.9)#23 | 13.9%(+19.6)#1,000 |
| 24. | Fountain | 33.3% | 13.6%(+19.7)#24 | 13.9%(+19.4)#1,012 |
| 25. | Germanton | 32.4% | 13.6%(+18.7)#25 | 13.9%(+18.4)#1,138 |
| 26. | Chocowinity | 32.2% | 13.6%(+18.6)#26 | 13.9%(+18.3)#1,158 |
| 27. | Ramseur | 32.2% | 13.6%(+18.5)#27 | 13.9%(+18.2)#1,167 |
| 28. | Rodanthe | 32.1% | 13.6%(+18.4)#28 | 13.9%(+18.1)#1,181 |
| 29. | Pittsboro | 32.0% | 13.6%(+18.4)#29 | 13.9%(+18.1)#1,197 |
| 30. | Stokes | 32.0% | 13.6%(+18.3)#30 | 13.9%(+18.0)#1,202 |
| 31. | Fairplains | 31.6% | 13.6%(+18.0)#31 | 13.9%(+17.7)#1,250 |
| 32. | Indian Beach | 31.5% | 13.6%(+17.9)#32 | 13.9%(+17.6)#1,265 |
| 33. | Pumpkin Center | 31.3% | 13.6%(+17.7)#33 | 13.9%(+17.4)#1,291 |
| 34. | Biltmore Forest | 31.3% | 13.6%(+17.7)#34 | 13.9%(+17.4)#1,292 |
| 35. | Maury | 31.2% | 13.6%(+17.6)#35 | 13.9%(+17.3)#1,298 |
| 36. | Bolton | 30.5% | 13.6%(+16.8)#36 | 13.9%(+16.5)#1,394 |
| 37. | Hertford | 30.3% | 13.6%(+16.6)#37 | 13.9%(+16.3)#1,427 |
| 38. | Southmont | 30.1% | 13.6%(+16.5)#38 | 13.9%(+16.2)#1,446 |
| 39. | Walnut Creek | 30.1% | 13.6%(+16.5)#39 | 13.9%(+16.2)#1,448 |
| 40. | Bent Creek | 30.1% | 13.6%(+16.5)#40 | 13.9%(+16.1)#1,456 |
| 41. | Caswell Beach | 29.9% | 13.6%(+16.3)#41 | 13.9%(+16.0)#1,492 |
| 42. | Vann Crossroads | 29.9% | 13.6%(+16.3)#42 | 13.9%(+16.0)#1,495 |
| 43. | Millers Creek | 29.7% | 13.6%(+16.1)#43 | 13.9%(+15.7)#1,517 |
| 44. | Garland | 29.6% | 13.6%(+16.0)#44 | 13.9%(+15.7)#1,521 |
| 45. | Spivey S Corner | 29.3% | 13.6%(+15.6)#45 | 13.9%(+15.3)#1,592 |
| 46. | East Bend | 29.0% | 13.6%(+15.4)#46 | 13.9%(+15.1)#1,632 |
| 47. | Bethel | 29.0% | 13.6%(+15.3)#47 | 13.9%(+15.0)#1,642 |
| 48. | Proctorville | 28.8% | 13.6%(+15.2)#48 | 13.9%(+14.9)#1,664 |
| 49. | Gold Hill | 28.7% | 13.6%(+15.1)#49 | 13.9%(+14.8)#1,682 |
| 50. | Grantsboro | 28.2% | 13.6%(+14.6)#50 | 13.9%(+14.3)#1,802 |
| 51. | Bath | 28.2% | 13.6%(+14.6)#51 | 13.9%(+14.3)#1,803 |
| 52. | Atkinson | 27.3% | 13.6%(+13.7)#52 | 13.9%(+13.4)#1,967 |
| 53. | White Oak | 26.9% | 13.6%(+13.3)#53 | 13.9%(+13.0)#2,051 |
| 54. | Bald Head Island | 26.9% | 13.6%(+13.3)#54 | 13.9%(+13.0)#2,055 |
| 55. | Edenton | 26.9% | 13.6%(+13.2)#55 | 13.9%(+12.9)#2,067 |
| 56. | Falcon | 26.8% | 13.6%(+13.2)#56 | 13.9%(+12.9)#2,088 |
| 57. | East Spencer | 26.7% | 13.6%(+13.1)#57 | 13.9%(+12.7)#2,114 |
| 58. | Stoneville | 26.5% | 13.6%(+12.9)#58 | 13.9%(+12.6)#2,167 |
| 59. | Halifax | 26.2% | 13.6%(+12.6)#59 | 13.9%(+12.3)#2,233 |
| 60. | Mount Gilead | 26.2% | 13.6%(+12.6)#60 | 13.9%(+12.2)#2,254 |
| 61. | Rennert | 26.1% | 13.6%(+12.4)#61 | 13.9%(+12.1)#2,293 |
| 62. | Weaverville | 25.8% | 13.6%(+12.2)#62 | 13.9%(+11.9)#2,347 |
| 63. | Barker Ten Mile | 25.4% | 13.6%(+11.8)#63 | 13.9%(+11.4)#2,478 |
| 64. | Five Points | 25.3% | 13.6%(+11.7)#64 | 13.9%(+11.3)#2,502 |
| 65. | Landis | 25.3% | 13.6%(+11.6)#65 | 13.9%(+11.3)#2,510 |
| 66. | Calypso | 25.0% | 13.6%(+11.4)#66 | 13.9%(+11.1)#2,586 |
| 67. | Grifton | 24.8% | 13.6%(+11.2)#67 | 13.9%(+10.9)#2,688 |
| 68. | Elrod | 24.7% | 13.6%(+11.1)#68 | 13.9%(+10.8)#2,740 |
| 69. | Scotland Neck | 24.0% | 13.6%(+10.3)#69 | 13.9%(+10.0)#2,999 |
| 70. | Boardman | 23.8% | 13.6%(+10.2)#70 | 13.9%(+9.91)#3,044 |
| 71. | Edneyville | 23.7% | 13.6%(+10.1)#71 | 13.9%(+9.80)#3,083 |
| 72. | Royal Pines | 23.4% | 13.6%(+9.82)#72 | 13.9%(+9.51)#3,232 |
| 73. | Red Springs | 23.4% | 13.6%(+9.76)#73 | 13.9%(+9.44)#3,267 |
| 74. | Crouse | 23.3% | 13.6%(+9.71)#74 | 13.9%(+9.40)#3,285 |
| 75. | Ahoskie | 23.2% | 13.6%(+9.62)#75 | 13.9%(+9.30)#3,329 |
| 76. | Lake Waccamaw | 23.1% | 13.6%(+9.49)#76 | 13.9%(+9.17)#3,385 |
| 77. | Pinnacle | 23.0% | 13.6%(+9.42)#77 | 13.9%(+9.11)#3,433 |
| 78. | Yanceyville | 22.9% | 13.6%(+9.29)#78 | 13.9%(+8.98)#3,492 |
| 79. | Gibson | 22.9% | 13.6%(+9.25)#79 | 13.9%(+8.93)#3,510 |
| 80. | Hillsborough | 22.8% | 13.6%(+9.17)#80 | 13.9%(+8.85)#3,545 |
| 81. | Maysville | 22.8% | 13.6%(+9.15)#81 | 13.9%(+8.83)#3,556 |
| 82. | Lake Royale | 22.6% | 13.6%(+8.95)#82 | 13.9%(+8.64)#3,653 |
| 83. | Goldston | 22.6% | 13.6%(+8.95)#83 | 13.9%(+8.63)#3,656 |
| 84. | Winterville | 22.6% | 13.6%(+8.94)#84 | 13.9%(+8.62)#3,659 |
| 85. | La Grange | 22.5% | 13.6%(+8.84)#85 | 13.9%(+8.52)#3,693 |
| 86. | Lilesville | 22.3% | 13.6%(+8.65)#86 | 13.9%(+8.33)#3,786 |
| 87. | Weldon | 22.2% | 13.6%(+8.56)#87 | 13.9%(+8.24)#3,843 |
| 88. | Mount Pleasant | 22.2% | 13.6%(+8.55)#88 | 13.9%(+8.23)#3,852 |
| 89. | Kinston | 22.1% | 13.6%(+8.49)#89 | 13.9%(+8.17)#3,872 |
| 90. | Foxfire | 22.1% | 13.6%(+8.49)#90 | 13.9%(+8.17)#3,873 |
| 91. | River Bend | 22.0% | 13.6%(+8.35)#91 | 13.9%(+8.03)#3,949 |
| 92. | Cape Carteret | 21.7% | 13.6%(+8.13)#92 | 13.9%(+7.81)#4,094 |
| 93. | Silver City | 21.7% | 13.6%(+8.11)#93 | 13.9%(+7.79)#4,116 |
| 94. | Stedman | 21.7% | 13.6%(+8.08)#94 | 13.9%(+7.76)#4,131 |
| 95. | Benson | 21.5% | 13.6%(+7.86)#95 | 13.9%(+7.54)#4,266 |
| 96. | Jackson Heights | 21.5% | 13.6%(+7.86)#96 | 13.9%(+7.54)#4,267 |
| 97. | Bowdens | 21.4% | 13.6%(+7.76)#97 | 13.9%(+7.44)#4,340 |
| 98. | Raemon | 21.4% | 13.6%(+7.74)#98 | 13.9%(+7.42)#4,351 |
| 99. | South Rosemary | 21.2% | 13.6%(+7.61)#99 | 13.9%(+7.29)#4,434 |
| 100. | Denver | 21.2% | 13.6%(+7.57)#100 | 13.9%(+7.25)#4,477 |
Common Questions
What are the Top 10 Cities with the Highest Percentage of Population Employed in Health Care & Social Assistance in North Carolina?
Top 10 Cities with the Highest Percentage of Population Employed in Health Care & Social Assistance in North Carolina are:
#1
71.4%
#2
62.0%
#3
54.8%
#4
54.7%
#5
54.5%
#6
52.7%
#7
42.9%
#8
42.7%
#9
40.0%
#10
37.0%
What city has the Highest Percentage of Population Employed in Health Care & Social Assistance in North Carolina?
Hallsboro has the Highest Percentage of Population Employed in Health Care & Social Assistance in North Carolina with 71.4%.
What is the Percentage of Population Employed in Health Care & Social Assistance in the State of North Carolina?
Percentage of Population Employed in Health Care & Social Assistance in North Carolina is 13.6%.
What is the Percentage of Population Employed in Health Care & Social Assistance in the United States?
Percentage of Population Employed in Health Care & Social Assistance in the United States is 13.9%.