Zip Codes with the Highest Percentage of Population Employed in Health Care & Social Assistance in San Jose, CA
RELATED REPORTS & OPTIONS
Health Care & Social Assistance
San Jose
Compare Zip Codes
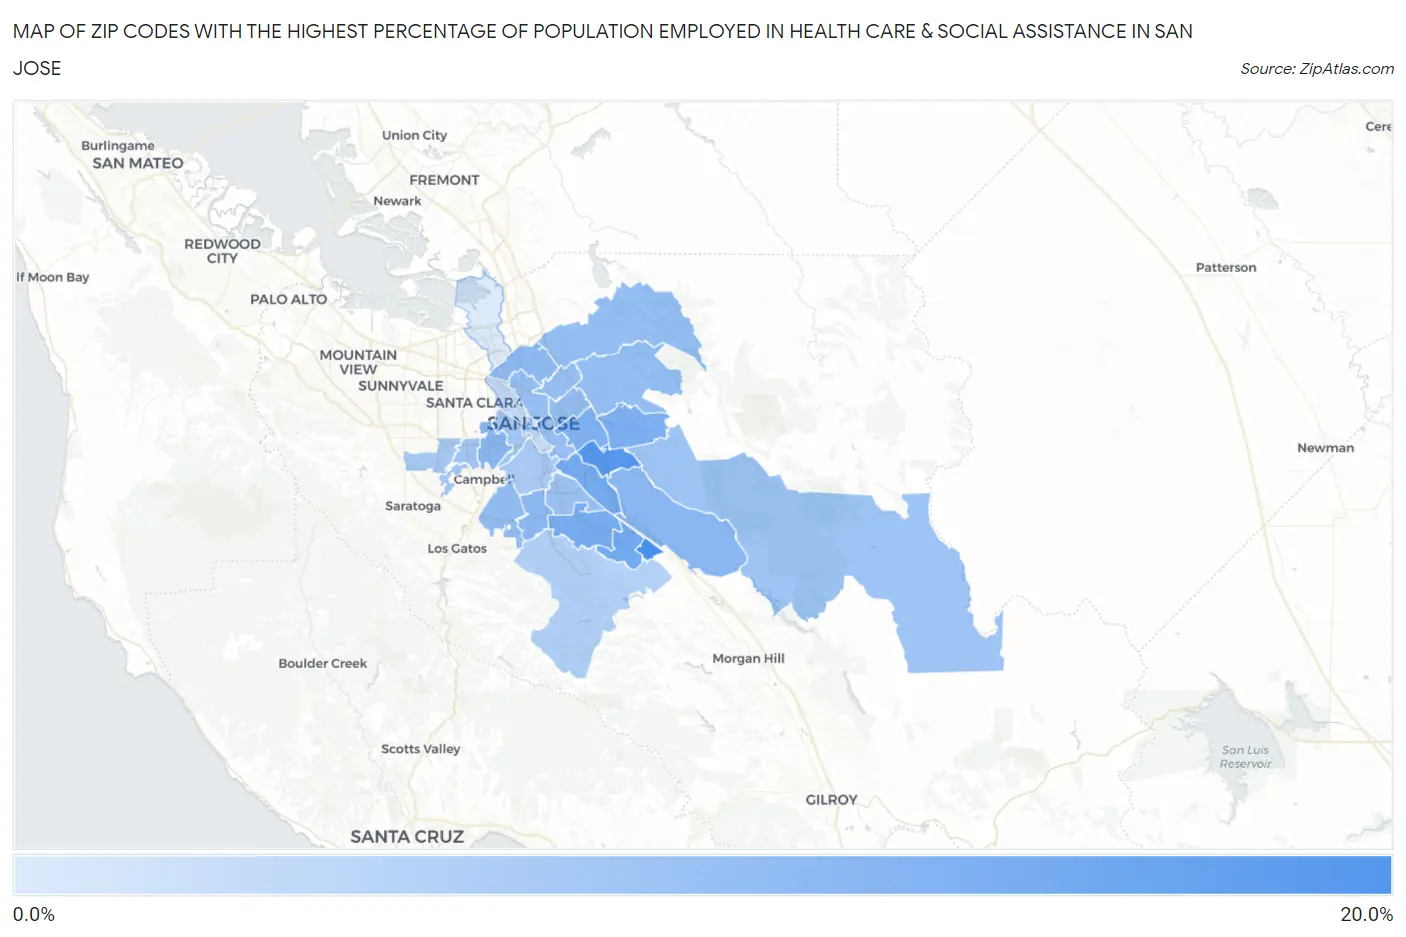
Map of Zip Codes with the Highest Percentage of Population Employed in Health Care & Social Assistance in San Jose
6.0%
18.0%
Zip Codes with the Highest Percentage of Population Employed in Health Care & Social Assistance in San Jose, CA
| Zip Code | % Employed | vs State | vs National | |
| 1. | 95139 | 18.0% | 12.7%(+5.21)#157 | 13.9%(+4.02)#6,238 |
| 2. | 95121 | 16.8% | 12.7%(+4.10)#211 | 13.9%(+2.90)#7,990 |
| 3. | 95119 | 14.4% | 12.7%(+1.66)#446 | 13.9%(+0.459)#13,104 |
| 4. | 95111 | 14.2% | 12.7%(+1.42)#478 | 13.9%(+0.218)#13,688 |
| 5. | 95123 | 13.9% | 12.7%(+1.17)#507 | 13.9%(-0.031)#14,297 |
| 6. | 95148 | 13.4% | 12.7%(+0.627)#594 | 13.9%(-0.570)#15,625 |
| 7. | 95122 | 13.2% | 12.7%(+0.436)#617 | 13.9%(-0.761)#16,131 |
| 8. | 95128 | 12.4% | 12.7%(-0.311)#768 | 13.9%(-1.51)#18,028 |
| 9. | 95138 | 12.4% | 12.7%(-0.315)#769 | 13.9%(-1.51)#18,039 |
| 10. | 95131 | 12.2% | 12.7%(-0.585)#822 | 13.9%(-1.78)#18,683 |
| 11. | 95118 | 12.0% | 12.7%(-0.710)#842 | 13.9%(-1.91)#18,966 |
| 12. | 95124 | 11.7% | 12.7%(-1.08)#917 | 13.9%(-2.28)#19,826 |
| 13. | 95132 | 11.6% | 12.7%(-1.17)#931 | 13.9%(-2.37)#20,052 |
| 14. | 95116 | 11.5% | 12.7%(-1.22)#939 | 13.9%(-2.42)#20,166 |
| 15. | 95127 | 11.4% | 12.7%(-1.30)#960 | 13.9%(-2.50)#20,354 |
| 16. | 95133 | 11.4% | 12.7%(-1.37)#973 | 13.9%(-2.57)#20,514 |
| 17. | 95112 | 11.2% | 12.7%(-1.49)#1,000 | 13.9%(-2.69)#20,790 |
| 18. | 95136 | 11.0% | 12.7%(-1.71)#1,029 | 13.9%(-2.90)#21,277 |
| 19. | 95135 | 10.8% | 12.7%(-1.90)#1,059 | 13.9%(-3.10)#21,713 |
| 20. | 95126 | 10.4% | 12.7%(-2.29)#1,117 | 13.9%(-3.49)#22,549 |
| 21. | 95117 | 10.4% | 12.7%(-2.35)#1,127 | 13.9%(-3.55)#22,674 |
| 22. | 95130 | 10.3% | 12.7%(-2.45)#1,142 | 13.9%(-3.64)#22,858 |
| 23. | 95129 | 10.0% | 12.7%(-2.70)#1,176 | 13.9%(-3.89)#23,334 |
| 24. | 95125 | 9.8% | 12.7%(-2.89)#1,197 | 13.9%(-4.09)#23,722 |
| 25. | 95120 | 9.2% | 12.7%(-3.50)#1,265 | 13.9%(-4.69)#24,803 |
| 26. | 95110 | 7.6% | 12.7%(-5.17)#1,384 | 13.9%(-6.37)#26,931 |
| 27. | 95113 | 6.7% | 12.7%(-6.09)#1,425 | 13.9%(-7.28)#27,833 |
| 28. | 95134 | 6.0% | 12.7%(-6.78)#1,449 | 13.9%(-7.98)#28,428 |
1
Common Questions
What are the Top 10 Zip Codes with the Highest Percentage of Population Employed in Health Care & Social Assistance in San Jose, CA?
Top 10 Zip Codes with the Highest Percentage of Population Employed in Health Care & Social Assistance in San Jose, CA are:
What zip code has the Highest Percentage of Population Employed in Health Care & Social Assistance in San Jose, CA?
95139 has the Highest Percentage of Population Employed in Health Care & Social Assistance in San Jose, CA with 18.0%.
What is the Percentage of Population Employed in Health Care & Social Assistance in San Jose, CA?
Percentage of Population Employed in Health Care & Social Assistance in San Jose is 11.6%.
What is the Percentage of Population Employed in Health Care & Social Assistance in California?
Percentage of Population Employed in Health Care & Social Assistance in California is 12.7%.
What is the Percentage of Population Employed in Health Care & Social Assistance in the United States?
Percentage of Population Employed in Health Care & Social Assistance in the United States is 13.9%.