Cities with the Highest Percentage of Population Employed in Health Care & Social Assistance in Missouri
RELATED REPORTS & OPTIONS
Health Care & Social Assistance
Missouri
Compare Cities
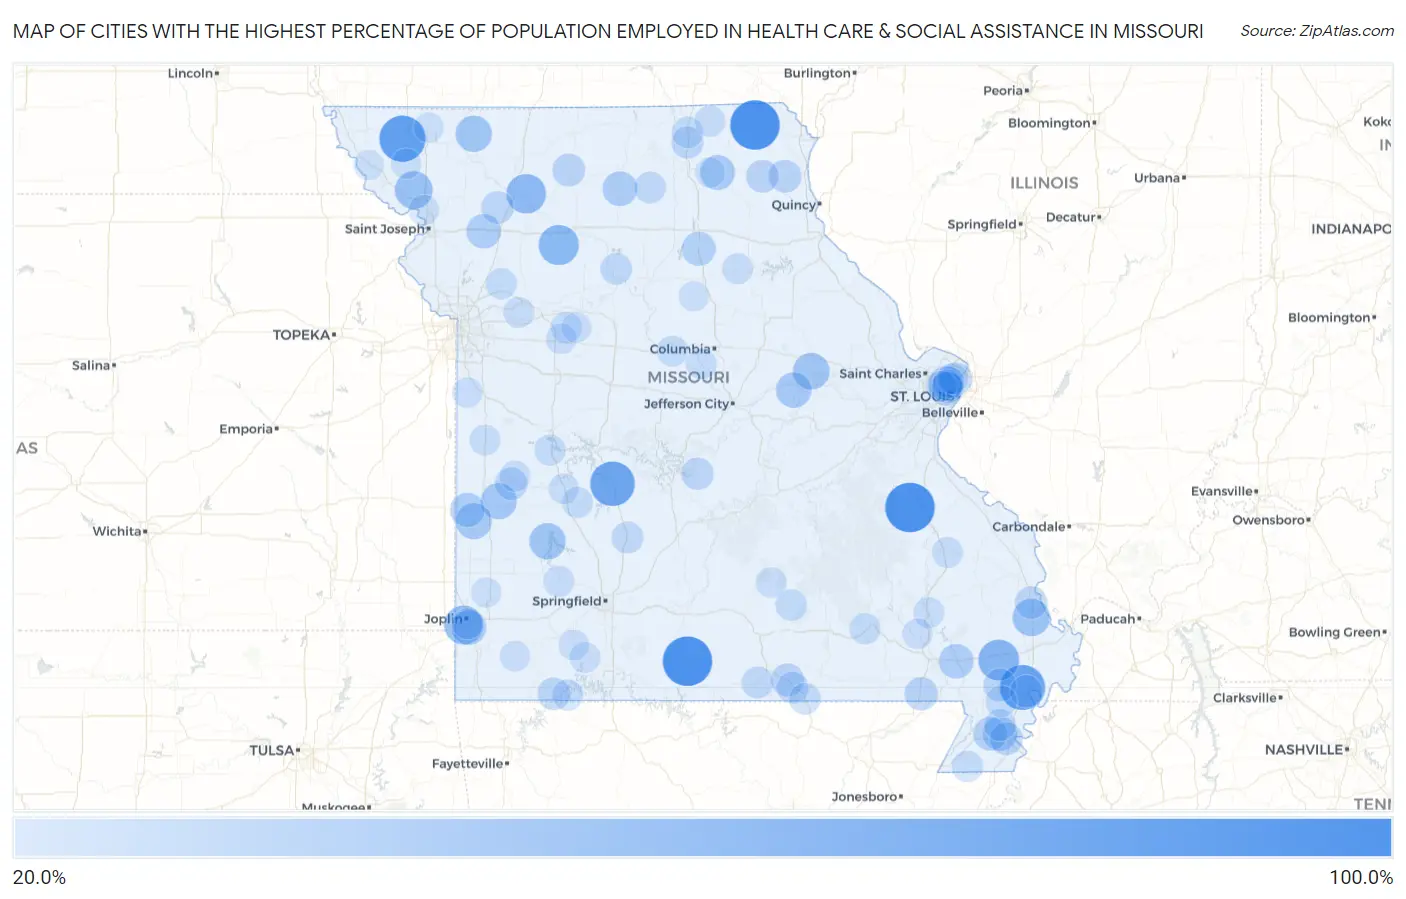
Map of Cities with the Highest Percentage of Population Employed in Health Care & Social Assistance in Missouri
0.0%
100.0%
Cities with the Highest Percentage of Population Employed in Health Care & Social Assistance in Missouri
| City | % Employed | vs State | vs National | |
| 1. | Frankclay | 100.0% | 14.8%(+85.2)#1 | 13.9%(+86.1)#20 |
| 2. | Wasola | 100.0% | 14.8%(+85.2)#2 | 13.9%(+86.1)#25 |
| 3. | Granger | 100.0% | 14.8%(+85.2)#3 | 13.9%(+86.1)#72 |
| 4. | Quitman | 87.5% | 14.8%(+72.7)#4 | 13.9%(+73.6)#79 |
| 5. | North Lilbourn | 83.3% | 14.8%(+68.5)#5 | 13.9%(+69.4)#87 |
| 6. | Cross Timbers | 81.2% | 14.8%(+66.5)#6 | 13.9%(+67.3)#89 |
| 7. | Penermon | 66.7% | 14.8%(+51.9)#7 | 13.9%(+52.7)#135 |
| 8. | Ludlow | 64.2% | 14.8%(+49.4)#8 | 13.9%(+50.2)#154 |
| 9. | Jameson | 61.8% | 14.8%(+47.0)#9 | 13.9%(+47.8)#170 |
| 10. | Prairie Hill | 60.0% | 14.8%(+45.2)#10 | 13.9%(+46.1)#182 |
| 11. | Grand Falls Plaza | 59.7% | 14.8%(+44.9)#11 | 13.9%(+45.8)#186 |
| 12. | Denton | 56.2% | 14.8%(+41.5)#12 | 13.9%(+42.3)#221 |
| 13. | Fillmore | 55.2% | 14.8%(+40.4)#13 | 13.9%(+41.2)#238 |
| 14. | Lambert | 53.6% | 14.8%(+38.8)#14 | 13.9%(+39.6)#266 |
| 15. | Big Spring | 51.0% | 14.8%(+36.2)#15 | 13.9%(+37.1)#314 |
| 16. | Worth | 50.0% | 14.8%(+35.2)#16 | 13.9%(+36.1)#335 |
| 17. | Umber View Heights | 50.0% | 14.8%(+35.2)#17 | 13.9%(+36.1)#336 |
| 18. | Walker | 49.1% | 14.8%(+34.3)#18 | 13.9%(+35.2)#361 |
| 19. | Moundville | 48.6% | 14.8%(+33.8)#19 | 13.9%(+34.6)#369 |
| 20. | Morrison | 47.1% | 14.8%(+32.3)#20 | 13.9%(+33.1)#393 |
| 21. | Grovespring | 46.7% | 14.8%(+31.9)#21 | 13.9%(+32.7)#404 |
| 22. | Pasadena Park | 46.4% | 14.8%(+31.6)#22 | 13.9%(+32.5)#413 |
| 23. | Frisbee | 45.5% | 14.8%(+30.7)#23 | 13.9%(+31.5)#437 |
| 24. | Hurdland | 45.1% | 14.8%(+30.3)#24 | 13.9%(+31.2)#443 |
| 25. | Shoal Creek Estates | 44.4% | 14.8%(+29.6)#25 | 13.9%(+30.5)#455 |
| 26. | Browning | 44.0% | 14.8%(+29.2)#26 | 13.9%(+30.1)#468 |
| 27. | Fisk | 43.8% | 14.8%(+29.0)#27 | 13.9%(+29.8)#473 |
| 28. | Osborn | 43.1% | 14.8%(+28.3)#28 | 13.9%(+29.2)#491 |
| 29. | Pascola | 42.9% | 14.8%(+28.1)#29 | 13.9%(+28.9)#500 |
| 30. | Deerfield | 42.9% | 14.8%(+28.1)#30 | 13.9%(+28.9)#502 |
| 31. | Excello | 40.9% | 14.8%(+26.1)#31 | 13.9%(+27.0)#558 |
| 32. | Wellston | 40.6% | 14.8%(+25.8)#32 | 13.9%(+26.6)#566 |
| 33. | Bragg City | 40.0% | 14.8%(+25.2)#33 | 13.9%(+26.1)#594 |
| 34. | Neelyville | 38.5% | 14.8%(+23.7)#34 | 13.9%(+24.5)#664 |
| 35. | Brandsville | 37.5% | 14.8%(+22.7)#35 | 13.9%(+23.6)#703 |
| 36. | Monticello | 37.2% | 14.8%(+22.4)#36 | 13.9%(+23.2)#726 |
| 37. | Tindall | 37.0% | 14.8%(+22.2)#37 | 13.9%(+23.0)#737 |
| 38. | Hayti Heights | 36.9% | 14.8%(+22.1)#38 | 13.9%(+22.9)#743 |
| 39. | Parma | 36.7% | 14.8%(+21.9)#39 | 13.9%(+22.7)#749 |
| 40. | La Belle | 36.7% | 14.8%(+21.9)#40 | 13.9%(+22.7)#750 |
| 41. | Goose Creek Lake | 36.4% | 14.8%(+21.6)#41 | 13.9%(+22.4)#771 |
| 42. | Weatherby | 36.4% | 14.8%(+21.6)#42 | 13.9%(+22.4)#777 |
| 43. | Schell City | 36.1% | 14.8%(+21.3)#43 | 13.9%(+22.2)#790 |
| 44. | Kelso | 35.9% | 14.8%(+21.1)#44 | 13.9%(+22.0)#803 |
| 45. | Eagle Rock | 35.9% | 14.8%(+21.1)#45 | 13.9%(+22.0)#805 |
| 46. | Riverview | 35.8% | 14.8%(+21.0)#46 | 13.9%(+21.9)#812 |
| 47. | Howardville | 35.7% | 14.8%(+20.9)#47 | 13.9%(+21.8)#818 |
| 48. | Brumley | 35.1% | 14.8%(+20.3)#48 | 13.9%(+21.2)#871 |
| 49. | Greentop | 34.7% | 14.8%(+19.9)#49 | 13.9%(+20.7)#903 |
| 50. | South Fork | 34.0% | 14.8%(+19.2)#50 | 13.9%(+20.0)#964 |
| 51. | Buffalo | 33.6% | 14.8%(+18.8)#51 | 13.9%(+19.7)#994 |
| 52. | Koshkonong | 33.3% | 14.8%(+18.5)#52 | 13.9%(+19.4)#1,021 |
| 53. | Shawneetown | 33.3% | 14.8%(+18.5)#53 | 13.9%(+19.4)#1,022 |
| 54. | Homestown | 33.3% | 14.8%(+18.5)#54 | 13.9%(+19.4)#1,028 |
| 55. | Triplett | 33.3% | 14.8%(+18.5)#55 | 13.9%(+19.4)#1,061 |
| 56. | Winigan | 33.3% | 14.8%(+18.5)#56 | 13.9%(+19.4)#1,062 |
| 57. | Thayer | 32.9% | 14.8%(+18.1)#57 | 13.9%(+18.9)#1,087 |
| 58. | Hillsdale | 32.9% | 14.8%(+18.1)#58 | 13.9%(+18.9)#1,088 |
| 59. | Tallapoosa | 32.5% | 14.8%(+17.7)#59 | 13.9%(+18.6)#1,124 |
| 60. | Queen City | 32.2% | 14.8%(+17.4)#60 | 13.9%(+18.3)#1,161 |
| 61. | Summersville | 32.2% | 14.8%(+17.4)#61 | 13.9%(+18.3)#1,162 |
| 62. | Van Buren | 31.8% | 14.8%(+17.0)#62 | 13.9%(+17.9)#1,226 |
| 63. | Hornersville | 31.6% | 14.8%(+16.8)#63 | 13.9%(+17.7)#1,251 |
| 64. | Country Club Hills | 31.6% | 14.8%(+16.8)#64 | 13.9%(+17.7)#1,253 |
| 65. | Corder | 31.4% | 14.8%(+16.6)#65 | 13.9%(+17.4)#1,287 |
| 66. | Excelsior Estates | 31.2% | 14.8%(+16.4)#66 | 13.9%(+17.3)#1,308 |
| 67. | Arrow Point | 31.0% | 14.8%(+16.2)#67 | 13.9%(+17.1)#1,328 |
| 68. | Deepwater | 31.0% | 14.8%(+16.2)#68 | 13.9%(+17.0)#1,332 |
| 69. | Windsor Place | 31.0% | 14.8%(+16.2)#69 | 13.9%(+17.0)#1,333 |
| 70. | Weaubleau | 30.8% | 14.8%(+16.0)#70 | 13.9%(+16.8)#1,351 |
| 71. | Philadelphia | 30.7% | 14.8%(+15.9)#71 | 13.9%(+16.8)#1,363 |
| 72. | Greenville | 30.6% | 14.8%(+15.8)#72 | 13.9%(+16.6)#1,378 |
| 73. | Downing | 30.6% | 14.8%(+15.8)#73 | 13.9%(+16.6)#1,379 |
| 74. | Cobalt | 30.6% | 14.8%(+15.8)#74 | 13.9%(+16.6)#1,386 |
| 75. | Dennis Acres | 30.6% | 14.8%(+15.8)#75 | 13.9%(+16.6)#1,387 |
| 76. | Rockville | 30.4% | 14.8%(+15.6)#76 | 13.9%(+16.5)#1,400 |
| 77. | Everton | 30.3% | 14.8%(+15.5)#77 | 13.9%(+16.4)#1,413 |
| 78. | Vinita Park | 30.2% | 14.8%(+15.4)#78 | 13.9%(+16.3)#1,429 |
| 79. | Moline Acres | 30.1% | 14.8%(+15.3)#79 | 13.9%(+16.1)#1,457 |
| 80. | Northwoods | 30.0% | 14.8%(+15.2)#80 | 13.9%(+16.1)#1,462 |
| 81. | Holliday | 30.0% | 14.8%(+15.2)#81 | 13.9%(+16.1)#1,466 |
| 82. | Passaic | 30.0% | 14.8%(+15.2)#82 | 13.9%(+16.1)#1,476 |
| 83. | Lupus | 30.0% | 14.8%(+15.2)#83 | 13.9%(+16.1)#1,481 |
| 84. | Fleming | 29.6% | 14.8%(+14.8)#84 | 13.9%(+15.7)#1,525 |
| 85. | Aullville | 29.4% | 14.8%(+14.6)#85 | 13.9%(+15.5)#1,568 |
| 86. | Raymondville | 29.4% | 14.8%(+14.6)#86 | 13.9%(+15.4)#1,573 |
| 87. | Galena | 29.1% | 14.8%(+14.3)#87 | 13.9%(+15.1)#1,626 |
| 88. | Crane | 28.7% | 14.8%(+13.9)#88 | 13.9%(+14.8)#1,685 |
| 89. | Amazonia | 28.6% | 14.8%(+13.8)#89 | 13.9%(+14.6)#1,707 |
| 90. | Graham | 28.6% | 14.8%(+13.8)#90 | 13.9%(+14.6)#1,716 |
| 91. | Lake Annette | 28.6% | 14.8%(+13.8)#91 | 13.9%(+14.6)#1,722 |
| 92. | Vista | 28.6% | 14.8%(+13.8)#92 | 13.9%(+14.6)#1,732 |
| 93. | Fairview | 28.5% | 14.8%(+13.7)#93 | 13.9%(+14.5)#1,750 |
| 94. | Williamsville | 28.4% | 14.8%(+13.6)#94 | 13.9%(+14.5)#1,762 |
| 95. | Alma | 28.3% | 14.8%(+13.5)#95 | 13.9%(+14.4)#1,781 |
| 96. | Craig | 28.2% | 14.8%(+13.4)#96 | 13.9%(+14.3)#1,805 |
| 97. | Brashear | 27.8% | 14.8%(+13.0)#97 | 13.9%(+13.8)#1,876 |
| 98. | Pickering | 27.7% | 14.8%(+12.9)#98 | 13.9%(+13.8)#1,892 |
| 99. | Higbee | 27.6% | 14.8%(+12.8)#99 | 13.9%(+13.7)#1,910 |
| 100. | Carytown | 27.6% | 14.8%(+12.8)#100 | 13.9%(+13.7)#1,912 |
Common Questions
What are the Top 10 Cities with the Highest Percentage of Population Employed in Health Care & Social Assistance in Missouri?
Top 10 Cities with the Highest Percentage of Population Employed in Health Care & Social Assistance in Missouri are:
#1
100.0%
#2
100.0%
#3
100.0%
#4
87.5%
#5
83.3%
#6
81.2%
#7
66.7%
#8
64.2%
#9
61.8%
#10
59.7%
What city has the Highest Percentage of Population Employed in Health Care & Social Assistance in Missouri?
Frankclay has the Highest Percentage of Population Employed in Health Care & Social Assistance in Missouri with 100.0%.
What is the Percentage of Population Employed in Health Care & Social Assistance in the State of Missouri?
Percentage of Population Employed in Health Care & Social Assistance in Missouri is 14.8%.
What is the Percentage of Population Employed in Health Care & Social Assistance in the United States?
Percentage of Population Employed in Health Care & Social Assistance in the United States is 13.9%.