Cities with the Highest Percentage of Population Employed in Health Care & Social Assistance in Kentucky
RELATED REPORTS & OPTIONS
Health Care & Social Assistance
Kentucky
Compare Cities
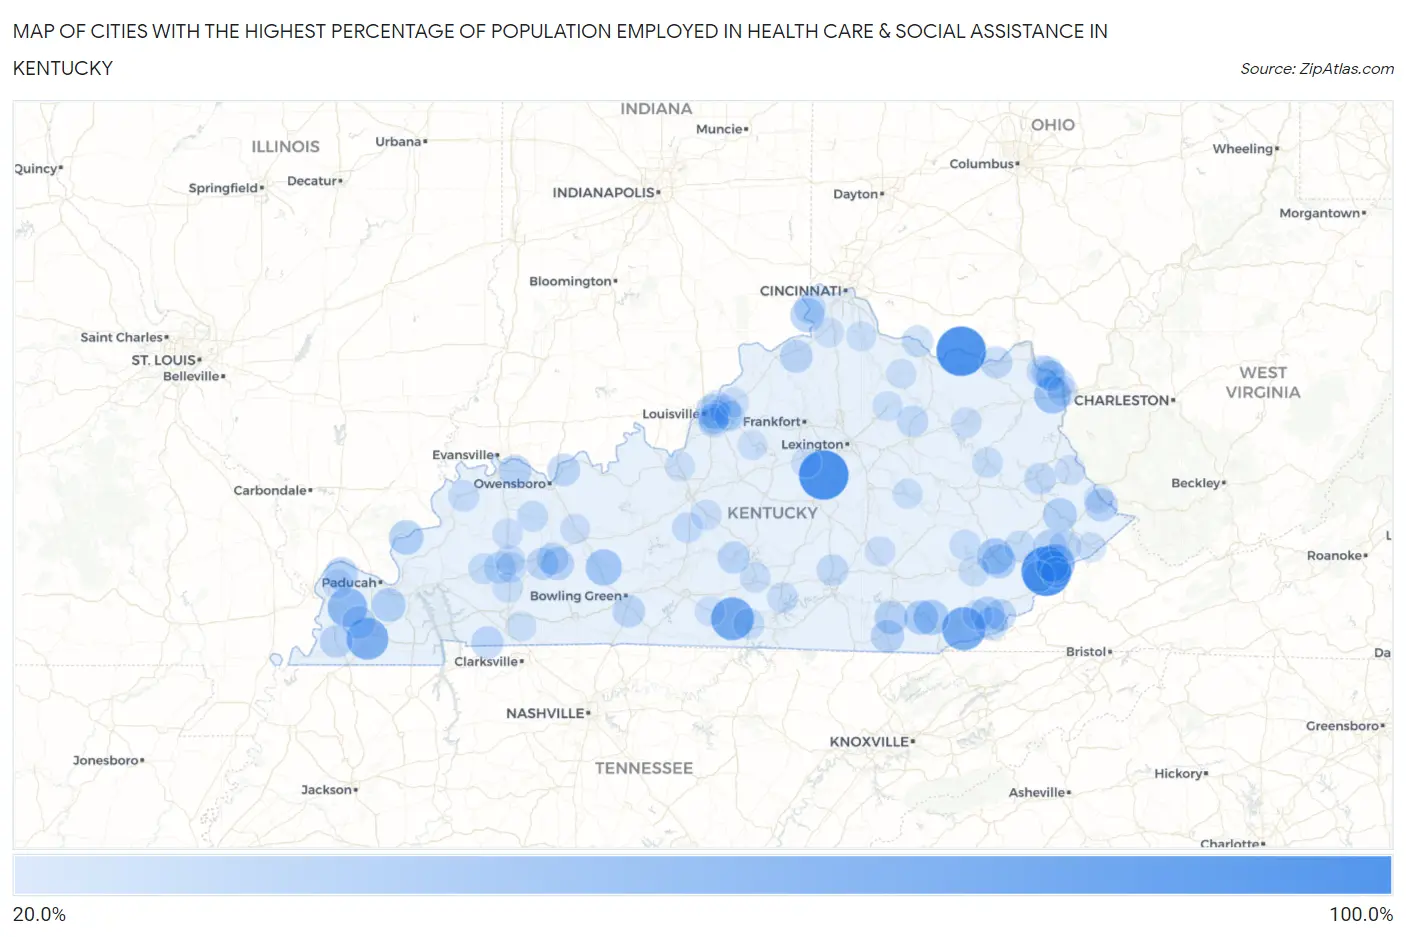
Map of Cities with the Highest Percentage of Population Employed in Health Care & Social Assistance in Kentucky
0.0%
100.0%
Cities with the Highest Percentage of Population Employed in Health Care & Social Assistance in Kentucky
| City | % Employed | vs State | vs National | |
| 1. | Millstone | 100.0% | 14.4%(+85.6)#1 | 13.9%(+86.1)#2 |
| 2. | High Bridge | 100.0% | 14.4%(+85.6)#2 | 13.9%(+86.1)#66 |
| 3. | Concord | 100.0% | 14.4%(+85.6)#3 | 13.9%(+86.1)#68 |
| 4. | Pathfork | 73.9% | 14.4%(+59.5)#4 | 13.9%(+60.0)#102 |
| 5. | Marrowbone | 72.0% | 14.4%(+57.6)#5 | 13.9%(+58.1)#108 |
| 6. | Knottsville | 67.8% | 14.4%(+53.3)#6 | 13.9%(+53.8)#129 |
| 7. | Pryorsburg | 67.4% | 14.4%(+53.0)#7 | 13.9%(+53.5)#132 |
| 8. | Cunningham | 58.1% | 14.4%(+43.7)#8 | 13.9%(+44.2)#202 |
| 9. | Mcroberts | 57.4% | 14.4%(+43.0)#9 | 13.9%(+43.5)#207 |
| 10. | Cannonsburg | 47.8% | 14.4%(+33.3)#10 | 13.9%(+33.8)#379 |
| 11. | Woodbury | 44.4% | 14.4%(+30.0)#11 | 13.9%(+30.5)#457 |
| 12. | Hazard | 43.2% | 14.4%(+28.8)#12 | 13.9%(+29.3)#486 |
| 13. | Flat Lick | 40.9% | 14.4%(+26.4)#13 | 13.9%(+26.9)#559 |
| 14. | Carrsville | 37.5% | 14.4%(+23.1)#14 | 13.9%(+23.6)#711 |
| 15. | Artemus | 37.3% | 14.4%(+22.8)#15 | 13.9%(+23.3)#719 |
| 16. | Rabbit Hash | 36.5% | 14.4%(+22.0)#16 | 13.9%(+22.5)#768 |
| 17. | Diablock | 36.1% | 14.4%(+21.6)#17 | 13.9%(+22.1)#791 |
| 18. | Coxton | 35.7% | 14.4%(+21.3)#18 | 13.9%(+21.8)#816 |
| 19. | Betsy Layne | 35.5% | 14.4%(+21.0)#19 | 13.9%(+21.5)#844 |
| 20. | Symsonia | 35.3% | 14.4%(+20.8)#20 | 13.9%(+21.3)#862 |
| 21. | Rockholds | 34.0% | 14.4%(+19.5)#21 | 13.9%(+20.0)#965 |
| 22. | Emlyn | 32.8% | 14.4%(+18.3)#22 | 13.9%(+18.8)#1,094 |
| 23. | Mockingbird Valley | 32.8% | 14.4%(+18.3)#23 | 13.9%(+18.8)#1,095 |
| 24. | Wheelwright | 32.6% | 14.4%(+18.2)#24 | 13.9%(+18.7)#1,110 |
| 25. | Cawood | 32.4% | 14.4%(+18.0)#25 | 13.9%(+18.5)#1,135 |
| 26. | Belfry | 32.0% | 14.4%(+17.6)#26 | 13.9%(+18.1)#1,191 |
| 27. | Bandana | 31.8% | 14.4%(+17.3)#27 | 13.9%(+17.8)#1,230 |
| 28. | Drakesboro | 31.6% | 14.4%(+17.2)#28 | 13.9%(+17.7)#1,243 |
| 29. | Fancy Farm | 31.6% | 14.4%(+17.2)#29 | 13.9%(+17.7)#1,249 |
| 30. | Sanders | 31.1% | 14.4%(+16.6)#30 | 13.9%(+17.1)#1,323 |
| 31. | Clinton | 30.7% | 14.4%(+16.2)#31 | 13.9%(+16.7)#1,368 |
| 32. | Spottsville | 30.4% | 14.4%(+15.9)#32 | 13.9%(+16.4)#1,409 |
| 33. | Lafayette | 30.1% | 14.4%(+15.7)#33 | 13.9%(+16.2)#1,452 |
| 34. | Maceo | 30.0% | 14.4%(+15.5)#34 | 13.9%(+16.0)#1,486 |
| 35. | Plano | 29.9% | 14.4%(+15.5)#35 | 13.9%(+16.0)#1,496 |
| 36. | Greenville | 29.4% | 14.4%(+15.0)#36 | 13.9%(+15.5)#1,571 |
| 37. | Greensburg | 29.2% | 14.4%(+14.8)#37 | 13.9%(+15.3)#1,604 |
| 38. | Raceland | 28.8% | 14.4%(+14.4)#38 | 13.9%(+14.9)#1,668 |
| 39. | Virgie | 28.6% | 14.4%(+14.2)#39 | 13.9%(+14.7)#1,695 |
| 40. | Cleaton | 28.3% | 14.4%(+13.9)#40 | 13.9%(+14.4)#1,785 |
| 41. | Kenvir | 28.3% | 14.4%(+13.8)#41 | 13.9%(+14.3)#1,790 |
| 42. | Garrison | 27.9% | 14.4%(+13.4)#42 | 13.9%(+13.9)#1,862 |
| 43. | West Van Lear | 27.7% | 14.4%(+13.3)#43 | 13.9%(+13.8)#1,884 |
| 44. | St Charles | 27.5% | 14.4%(+13.0)#44 | 13.9%(+13.5)#1,950 |
| 45. | Paintsville | 26.9% | 14.4%(+12.5)#45 | 13.9%(+13.0)#2,049 |
| 46. | Wurtland | 26.9% | 14.4%(+12.5)#46 | 13.9%(+13.0)#2,059 |
| 47. | Sharpsburg | 26.5% | 14.4%(+12.0)#47 | 13.9%(+12.6)#2,172 |
| 48. | Science Hill | 26.4% | 14.4%(+12.0)#48 | 13.9%(+12.5)#2,195 |
| 49. | Belleview | 26.3% | 14.4%(+11.8)#49 | 13.9%(+12.3)#2,229 |
| 50. | Fleming Neon | 26.1% | 14.4%(+11.6)#50 | 13.9%(+12.1)#2,290 |
| 51. | Strathmoor Manor | 25.8% | 14.4%(+11.3)#51 | 13.9%(+11.8)#2,369 |
| 52. | Dover | 25.5% | 14.4%(+11.0)#52 | 13.9%(+11.5)#2,448 |
| 53. | Whitesburg | 25.2% | 14.4%(+10.7)#53 | 13.9%(+11.3)#2,537 |
| 54. | Burkesville | 25.1% | 14.4%(+10.7)#54 | 13.9%(+11.2)#2,563 |
| 55. | Sycamore | 25.0% | 14.4%(+10.6)#55 | 13.9%(+11.1)#2,606 |
| 56. | Hindman | 24.8% | 14.4%(+10.4)#56 | 13.9%(+10.9)#2,687 |
| 57. | Calhoun | 24.7% | 14.4%(+10.2)#57 | 13.9%(+10.7)#2,750 |
| 58. | Breckinridge Center | 24.6% | 14.4%(+10.2)#58 | 13.9%(+10.7)#2,771 |
| 59. | Dawson Springs | 24.3% | 14.4%(+9.90)#59 | 13.9%(+10.4)#2,846 |
| 60. | Upton | 24.1% | 14.4%(+9.63)#60 | 13.9%(+10.1)#2,955 |
| 61. | Ashland | 23.7% | 14.4%(+9.27)#61 | 13.9%(+9.77)#3,094 |
| 62. | Glenview | 23.7% | 14.4%(+9.25)#62 | 13.9%(+9.76)#3,104 |
| 63. | Flatwoods | 23.6% | 14.4%(+9.13)#63 | 13.9%(+9.64)#3,160 |
| 64. | West Liberty | 23.6% | 14.4%(+9.11)#64 | 13.9%(+9.62)#3,168 |
| 65. | Buckhorn | 23.3% | 14.4%(+8.89)#65 | 13.9%(+9.40)#3,290 |
| 66. | Russell | 23.2% | 14.4%(+8.78)#66 | 13.9%(+9.29)#3,330 |
| 67. | Jamestown | 22.9% | 14.4%(+8.47)#67 | 13.9%(+8.98)#3,493 |
| 68. | Hyden | 22.9% | 14.4%(+8.44)#68 | 13.9%(+8.95)#3,504 |
| 69. | Payne Gap | 22.7% | 14.4%(+8.28)#69 | 13.9%(+8.79)#3,579 |
| 70. | Catlettsburg | 22.6% | 14.4%(+8.19)#70 | 13.9%(+8.70)#3,628 |
| 71. | Nortonville | 22.6% | 14.4%(+8.14)#71 | 13.9%(+8.64)#3,642 |
| 72. | Columbia | 22.5% | 14.4%(+8.05)#72 | 13.9%(+8.56)#3,681 |
| 73. | West Buechel | 22.4% | 14.4%(+7.91)#73 | 13.9%(+8.42)#3,746 |
| 74. | Hodgenville | 22.3% | 14.4%(+7.87)#74 | 13.9%(+8.37)#3,767 |
| 75. | Morehead | 22.2% | 14.4%(+7.73)#75 | 13.9%(+8.23)#3,850 |
| 76. | Livingston | 22.0% | 14.4%(+7.56)#76 | 13.9%(+8.06)#3,935 |
| 77. | Meadowbrook Farm | 22.0% | 14.4%(+7.56)#77 | 13.9%(+8.06)#3,936 |
| 78. | Norbourne Estates | 21.8% | 14.4%(+7.36)#78 | 13.9%(+7.87)#4,056 |
| 79. | Hanson | 21.8% | 14.4%(+7.32)#79 | 13.9%(+7.83)#4,085 |
| 80. | Salvisa | 21.7% | 14.4%(+7.25)#80 | 13.9%(+7.76)#4,133 |
| 81. | Hartford | 21.5% | 14.4%(+7.03)#81 | 13.9%(+7.54)#4,269 |
| 82. | Inez | 21.5% | 14.4%(+7.03)#82 | 13.9%(+7.53)#4,272 |
| 83. | Crofton | 21.4% | 14.4%(+6.92)#83 | 13.9%(+7.42)#4,350 |
| 84. | Millersburg | 21.3% | 14.4%(+6.89)#84 | 13.9%(+7.39)#4,366 |
| 85. | Woodland Hills | 21.2% | 14.4%(+6.78)#85 | 13.9%(+7.29)#4,443 |
| 86. | Irvine | 21.2% | 14.4%(+6.75)#86 | 13.9%(+7.26)#4,473 |
| 87. | Mortons Gap | 21.2% | 14.4%(+6.72)#87 | 13.9%(+7.23)#4,497 |
| 88. | Summer Shade | 21.1% | 14.4%(+6.65)#88 | 13.9%(+7.16)#4,542 |
| 89. | Loyall | 21.0% | 14.4%(+6.58)#89 | 13.9%(+7.09)#4,602 |
| 90. | La Center | 21.0% | 14.4%(+6.57)#90 | 13.9%(+7.08)#4,610 |
| 91. | Pembroke | 20.9% | 14.4%(+6.45)#91 | 13.9%(+6.96)#4,709 |
| 92. | Taylorsville | 20.9% | 14.4%(+6.44)#92 | 13.9%(+6.95)#4,718 |
| 93. | Fort Knox | 20.7% | 14.4%(+6.21)#93 | 13.9%(+6.72)#4,895 |
| 94. | Butler | 20.6% | 14.4%(+6.17)#94 | 13.9%(+6.68)#4,919 |
| 95. | Kingsley | 20.6% | 14.4%(+6.14)#95 | 13.9%(+6.65)#4,948 |
| 96. | Verona | 20.6% | 14.4%(+6.12)#96 | 13.9%(+6.63)#4,969 |
| 97. | Elkhorn City | 20.5% | 14.4%(+6.04)#97 | 13.9%(+6.55)#5,023 |
| 98. | Mount Olivet | 20.4% | 14.4%(+5.96)#98 | 13.9%(+6.47)#5,085 |
| 99. | South Williamson | 20.4% | 14.4%(+5.95)#99 | 13.9%(+6.46)#5,093 |
| 100. | Crestwood | 20.3% | 14.4%(+5.89)#100 | 13.9%(+6.40)#5,143 |
Common Questions
What are the Top 10 Cities with the Highest Percentage of Population Employed in Health Care & Social Assistance in Kentucky?
Top 10 Cities with the Highest Percentage of Population Employed in Health Care & Social Assistance in Kentucky are:
#1
100.0%
#2
100.0%
#3
100.0%
#4
73.9%
#5
72.0%
#6
67.4%
#7
58.1%
#8
57.4%
#9
47.8%
#10
44.4%
What city has the Highest Percentage of Population Employed in Health Care & Social Assistance in Kentucky?
Millstone has the Highest Percentage of Population Employed in Health Care & Social Assistance in Kentucky with 100.0%.
What is the Percentage of Population Employed in Health Care & Social Assistance in the State of Kentucky?
Percentage of Population Employed in Health Care & Social Assistance in Kentucky is 14.4%.
What is the Percentage of Population Employed in Health Care & Social Assistance in the United States?
Percentage of Population Employed in Health Care & Social Assistance in the United States is 13.9%.