Cities with the Highest Percentage of Population Employed in Health Care & Social Assistance in Oregon
RELATED REPORTS & OPTIONS
Health Care & Social Assistance
Oregon
Compare Cities
Map of Cities with the Highest Percentage of Population Employed in Health Care & Social Assistance in Oregon
0.0%
100.0%
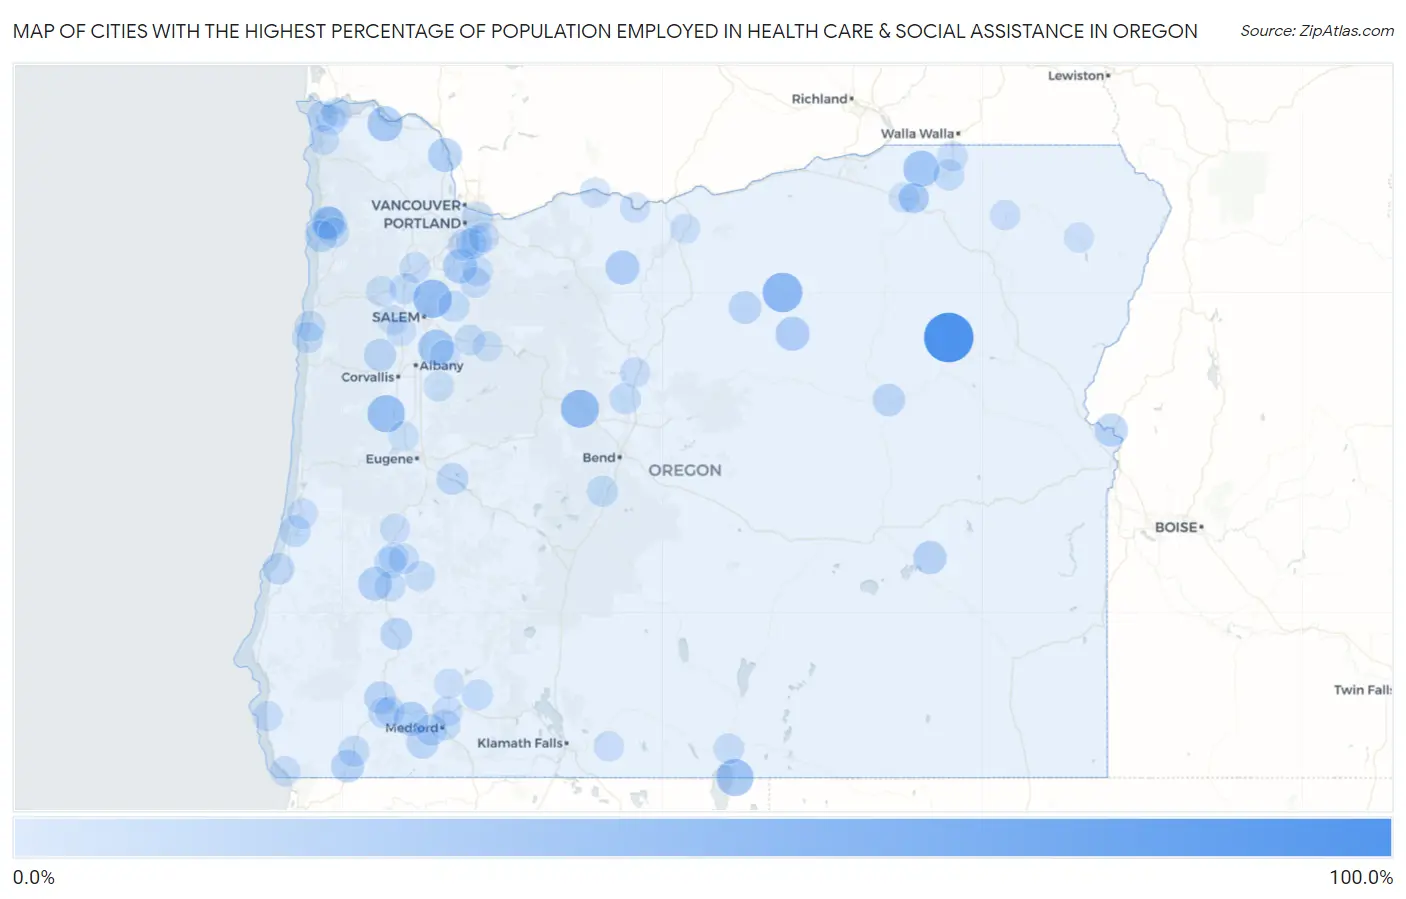
Cities with the Highest Percentage of Population Employed in Health Care & Social Assistance in Oregon
| City | % Employed | vs State | vs National | |
| 1. | Meacham | 100.0% | 14.8%(+85.2)#1 | 13.9%(+86.1)#19 |
| 2. | Granite | 100.0% | 14.8%(+85.2)#2 | 13.9%(+86.1)#71 |
| 3. | Trent | 57.4% | 14.8%(+42.7)#3 | 13.9%(+43.5)#206 |
| 4. | Lonerock | 57.1% | 14.8%(+42.4)#4 | 13.9%(+43.2)#213 |
| 5. | Brooks | 51.1% | 14.8%(+36.3)#5 | 13.9%(+37.2)#312 |
| 6. | Black Butte Ranch | 50.0% | 14.8%(+35.2)#6 | 13.9%(+36.1)#325 |
| 7. | Alpine | 47.2% | 14.8%(+32.4)#7 | 13.9%(+33.2)#390 |
| 8. | New Pine Creek | 45.7% | 14.8%(+30.9)#8 | 13.9%(+31.8)#430 |
| 9. | San Marine | 42.3% | 14.8%(+27.5)#9 | 13.9%(+28.3)#522 |
| 10. | Helix | 42.1% | 14.8%(+27.3)#10 | 13.9%(+28.1)#525 |
| 11. | Marion | 41.1% | 14.8%(+26.3)#11 | 13.9%(+27.1)#553 |
| 12. | Westport | 38.0% | 14.8%(+23.2)#12 | 13.9%(+24.0)#689 |
| 13. | Running Y Ranch | 35.9% | 14.8%(+21.1)#13 | 13.9%(+21.9)#807 |
| 14. | Rocky Point | 34.8% | 14.8%(+20.0)#14 | 13.9%(+20.8)#891 |
| 15. | Falcon Heights | 34.7% | 14.8%(+19.9)#15 | 13.9%(+20.8)#900 |
| 16. | Barlow | 34.5% | 14.8%(+19.7)#16 | 13.9%(+20.5)#926 |
| 17. | Pine Hollow | 34.2% | 14.8%(+19.4)#17 | 13.9%(+20.2)#946 |
| 18. | Spray | 34.0% | 14.8%(+19.2)#18 | 13.9%(+20.0)#962 |
| 19. | Foots Creek | 33.7% | 14.8%(+18.9)#19 | 13.9%(+19.8)#987 |
| 20. | Deer Island | 33.3% | 14.8%(+18.5)#20 | 13.9%(+19.4)#1,014 |
| 21. | Oregon Shores | 32.7% | 14.8%(+17.9)#21 | 13.9%(+18.8)#1,100 |
| 22. | Melrose | 31.4% | 14.8%(+16.6)#22 | 13.9%(+17.5)#1,280 |
| 23. | Idaville | 30.8% | 14.8%(+16.0)#23 | 13.9%(+16.8)#1,356 |
| 24. | Crane | 30.0% | 14.8%(+15.2)#24 | 13.9%(+16.1)#1,467 |
| 25. | Annex | 29.6% | 14.8%(+14.8)#25 | 13.9%(+15.7)#1,535 |
| 26. | Bay City | 28.6% | 14.8%(+13.8)#26 | 13.9%(+14.6)#1,738 |
| 27. | O Brien | 28.2% | 14.8%(+13.4)#27 | 13.9%(+14.3)#1,801 |
| 28. | Fossil | 27.9% | 14.8%(+13.1)#28 | 13.9%(+14.0)#1,854 |
| 29. | Mckay | 27.7% | 14.8%(+12.9)#29 | 13.9%(+13.8)#1,894 |
| 30. | John Day | 27.2% | 14.8%(+12.4)#30 | 13.9%(+13.2)#2,001 |
| 31. | Kings Valley | 26.5% | 14.8%(+11.7)#31 | 13.9%(+12.6)#2,170 |
| 32. | Bayshore | 26.2% | 14.8%(+11.4)#32 | 13.9%(+12.3)#2,231 |
| 33. | Ruch | 25.9% | 14.8%(+11.1)#33 | 13.9%(+12.0)#2,322 |
| 34. | Merlin | 25.8% | 14.8%(+11.0)#34 | 13.9%(+11.8)#2,373 |
| 35. | Canyonville | 25.3% | 14.8%(+10.5)#35 | 13.9%(+11.4)#2,492 |
| 36. | Netarts | 25.2% | 14.8%(+10.4)#36 | 13.9%(+11.3)#2,532 |
| 37. | Lowell | 24.6% | 14.8%(+9.82)#37 | 13.9%(+10.7)#2,765 |
| 38. | Barview | 24.1% | 14.8%(+9.31)#38 | 13.9%(+10.2)#2,944 |
| 39. | Stafford | 23.9% | 14.8%(+9.06)#39 | 13.9%(+9.92)#3,039 |
| 40. | Johnson City | 23.7% | 14.8%(+8.92)#40 | 13.9%(+9.77)#3,096 |
| 41. | Sutherlin | 23.6% | 14.8%(+8.85)#41 | 13.9%(+9.71)#3,129 |
| 42. | Maywood Park | 23.6% | 14.8%(+8.82)#42 | 13.9%(+9.68)#3,142 |
| 43. | Marcola | 23.5% | 14.8%(+8.70)#43 | 13.9%(+9.55)#3,206 |
| 44. | Lakeside | 22.9% | 14.8%(+8.14)#44 | 13.9%(+9.00)#3,481 |
| 45. | Jacksonville | 22.5% | 14.8%(+7.73)#45 | 13.9%(+8.59)#3,666 |
| 46. | Depoe Bay | 22.2% | 14.8%(+7.37)#46 | 13.9%(+8.23)#3,855 |
| 47. | Crooked River Ranch | 21.9% | 14.8%(+7.11)#47 | 13.9%(+7.96)#3,995 |
| 48. | Weston | 21.7% | 14.8%(+6.90)#48 | 13.9%(+7.76)#4,137 |
| 49. | Cave Junction | 21.7% | 14.8%(+6.89)#49 | 13.9%(+7.74)#4,146 |
| 50. | Three Rivers | 21.7% | 14.8%(+6.86)#50 | 13.9%(+7.72)#4,163 |
| 51. | Silverton | 21.6% | 14.8%(+6.76)#51 | 13.9%(+7.62)#4,226 |
| 52. | Butte Falls | 21.3% | 14.8%(+6.55)#52 | 13.9%(+7.41)#4,358 |
| 53. | Amity | 21.2% | 14.8%(+6.44)#53 | 13.9%(+7.30)#4,429 |
| 54. | Redwood | 21.2% | 14.8%(+6.41)#54 | 13.9%(+7.27)#4,459 |
| 55. | Lafayette | 21.0% | 14.8%(+6.20)#55 | 13.9%(+7.06)#4,630 |
| 56. | Jennings Lodge | 20.9% | 14.8%(+6.13)#56 | 13.9%(+6.99)#4,688 |
| 57. | Medford | 20.7% | 14.8%(+5.95)#57 | 13.9%(+6.81)#4,821 |
| 58. | Roseburg | 20.6% | 14.8%(+5.81)#58 | 13.9%(+6.67)#4,937 |
| 59. | Pleasant Valley | 20.3% | 14.8%(+5.55)#59 | 13.9%(+6.41)#5,133 |
| 60. | Mehama | 20.2% | 14.8%(+5.42)#60 | 13.9%(+6.27)#5,248 |
| 61. | Tillamook | 20.2% | 14.8%(+5.37)#61 | 13.9%(+6.23)#5,277 |
| 62. | Molalla | 20.2% | 14.8%(+5.36)#62 | 13.9%(+6.22)#5,293 |
| 63. | Glide | 20.1% | 14.8%(+5.31)#63 | 13.9%(+6.17)#5,341 |
| 64. | Lincoln Beach | 20.0% | 14.8%(+5.22)#64 | 13.9%(+6.08)#5,387 |
| 65. | Fair Oaks | 20.0% | 14.8%(+5.21)#65 | 13.9%(+6.06)#5,428 |
| 66. | Jeffers Gardens | 20.0% | 14.8%(+5.21)#66 | 13.9%(+6.06)#5,441 |
| 67. | Lakeview | 20.0% | 14.8%(+5.18)#67 | 13.9%(+6.04)#5,478 |
| 68. | Warrenton | 19.9% | 14.8%(+5.09)#68 | 13.9%(+5.94)#5,551 |
| 69. | Sheridan | 19.6% | 14.8%(+4.83)#69 | 13.9%(+5.68)#5,772 |
| 70. | Reedsport | 19.6% | 14.8%(+4.81)#70 | 13.9%(+5.67)#5,788 |
| 71. | Harbor | 19.6% | 14.8%(+4.80)#71 | 13.9%(+5.66)#5,792 |
| 72. | Milton Freewater | 19.5% | 14.8%(+4.68)#72 | 13.9%(+5.53)#5,892 |
| 73. | Gold Beach | 19.2% | 14.8%(+4.40)#73 | 13.9%(+5.26)#6,150 |
| 74. | Mulino | 19.2% | 14.8%(+4.38)#74 | 13.9%(+5.23)#6,179 |
| 75. | Gearhart | 19.1% | 14.8%(+4.35)#75 | 13.9%(+5.21)#6,201 |
| 76. | White City | 19.0% | 14.8%(+4.19)#76 | 13.9%(+5.05)#6,369 |
| 77. | Happy Valley | 19.0% | 14.8%(+4.16)#77 | 13.9%(+5.02)#6,403 |
| 78. | Gopher Flats | 18.9% | 14.8%(+4.09)#78 | 13.9%(+4.95)#6,473 |
| 79. | Hood River | 18.9% | 14.8%(+4.09)#79 | 13.9%(+4.94)#6,476 |
| 80. | Bonanza | 18.8% | 14.8%(+3.98)#80 | 13.9%(+4.83)#6,565 |
| 81. | Metolius | 18.8% | 14.8%(+3.97)#81 | 13.9%(+4.83)#6,569 |
| 82. | Junction City | 18.7% | 14.8%(+3.87)#82 | 13.9%(+4.73)#6,682 |
| 83. | South Lebanon | 18.6% | 14.8%(+3.83)#83 | 13.9%(+4.68)#6,735 |
| 84. | Elgin | 18.6% | 14.8%(+3.80)#84 | 13.9%(+4.66)#6,771 |
| 85. | The Dalles | 18.5% | 14.8%(+3.67)#85 | 13.9%(+4.53)#6,896 |
| 86. | Grants Pass | 18.4% | 14.8%(+3.59)#86 | 13.9%(+4.45)#6,977 |
| 87. | Yoncalla | 18.4% | 14.8%(+3.56)#87 | 13.9%(+4.42)#7,015 |
| 88. | Shady Cove | 18.2% | 14.8%(+3.36)#88 | 13.9%(+4.22)#7,268 |
| 89. | Scio | 18.1% | 14.8%(+3.32)#89 | 13.9%(+4.17)#7,316 |
| 90. | Mill City | 18.1% | 14.8%(+3.29)#90 | 13.9%(+4.14)#7,341 |
| 91. | Enterprise | 18.1% | 14.8%(+3.27)#91 | 13.9%(+4.13)#7,365 |
| 92. | Pendleton | 17.9% | 14.8%(+3.14)#92 | 13.9%(+4.00)#7,525 |
| 93. | Dallas | 17.9% | 14.8%(+3.10)#93 | 13.9%(+3.96)#7,575 |
| 94. | Dunthorpe | 17.8% | 14.8%(+3.04)#94 | 13.9%(+3.90)#7,656 |
| 95. | Monmouth | 17.7% | 14.8%(+2.90)#95 | 13.9%(+3.76)#7,823 |
| 96. | Crescent | 17.7% | 14.8%(+2.90)#96 | 13.9%(+3.75)#7,832 |
| 97. | Moro | 17.6% | 14.8%(+2.86)#97 | 13.9%(+3.71)#7,892 |
| 98. | Oakland | 17.6% | 14.8%(+2.84)#98 | 13.9%(+3.70)#7,923 |
| 99. | Astoria | 17.6% | 14.8%(+2.83)#99 | 13.9%(+3.69)#7,936 |
| 100. | Riverside | 17.6% | 14.8%(+2.82)#100 | 13.9%(+3.68)#7,948 |
Common Questions
What are the Top 10 Cities with the Highest Percentage of Population Employed in Health Care & Social Assistance in Oregon?
Top 10 Cities with the Highest Percentage of Population Employed in Health Care & Social Assistance in Oregon are:
#1
100.0%
#2
57.1%
#3
51.1%
#4
50.0%
#5
47.2%
#6
45.7%
#7
42.1%
#8
41.1%
#9
38.0%
#10
34.5%
What city has the Highest Percentage of Population Employed in Health Care & Social Assistance in Oregon?
Granite has the Highest Percentage of Population Employed in Health Care & Social Assistance in Oregon with 100.0%.
What is the Percentage of Population Employed in Health Care & Social Assistance in the State of Oregon?
Percentage of Population Employed in Health Care & Social Assistance in Oregon is 14.8%.
What is the Percentage of Population Employed in Health Care & Social Assistance in the United States?
Percentage of Population Employed in Health Care & Social Assistance in the United States is 13.9%.