Zip Codes with the Highest Percentage of Population Employed in Health Care & Social Assistance in Yorba Linda, CA
RELATED REPORTS & OPTIONS
Health Care & Social Assistance
Yorba Linda
Compare Zip Codes
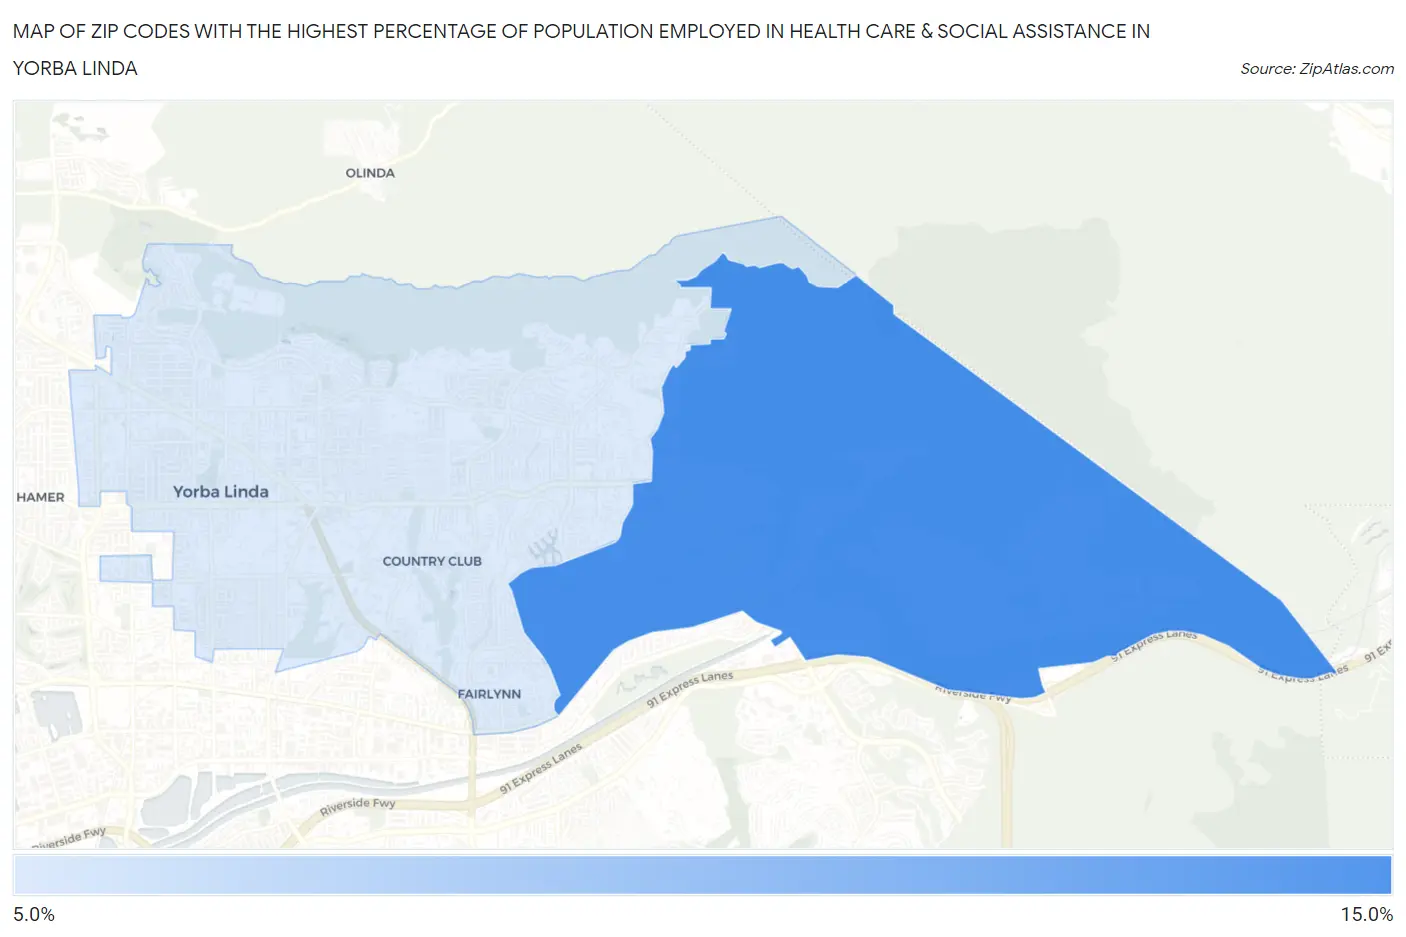
Map of Zip Codes with the Highest Percentage of Population Employed in Health Care & Social Assistance in Yorba Linda
11.4%
13.7%
Zip Codes with the Highest Percentage of Population Employed in Health Care & Social Assistance in Yorba Linda, CA
| Zip Code | % Employed | vs State | vs National | |
| 1. | 92887 | 13.7% | 12.7%(+1.01)#539 | 13.9%(-0.188)#14,684 |
| 2. | 92886 | 11.4% | 12.7%(-1.33)#964 | 13.9%(-2.53)#20,425 |
1
Common Questions
What are the Top Zip Codes with the Highest Percentage of Population Employed in Health Care & Social Assistance in Yorba Linda, CA?
Top Zip Codes with the Highest Percentage of Population Employed in Health Care & Social Assistance in Yorba Linda, CA are:
What zip code has the Highest Percentage of Population Employed in Health Care & Social Assistance in Yorba Linda, CA?
92887 has the Highest Percentage of Population Employed in Health Care & Social Assistance in Yorba Linda, CA with 13.7%.
What is the Percentage of Population Employed in Health Care & Social Assistance in Yorba Linda, CA?
Percentage of Population Employed in Health Care & Social Assistance in Yorba Linda is 12.2%.
What is the Percentage of Population Employed in Health Care & Social Assistance in California?
Percentage of Population Employed in Health Care & Social Assistance in California is 12.7%.
What is the Percentage of Population Employed in Health Care & Social Assistance in the United States?
Percentage of Population Employed in Health Care & Social Assistance in the United States is 13.9%.